KrishaWeb has delivered over 1,000 WordPress projects since 2008. The advice below comes from that work.
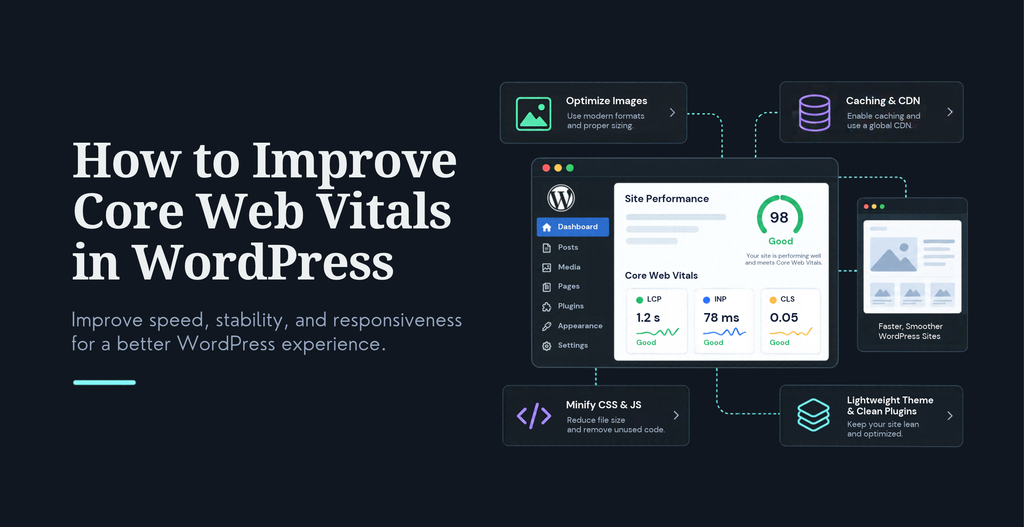
To improve Core Web Vitals in WordPress, find the one metric that is failing, work out why, and fix that first. Google measures three. Largest Contentful Paint (LCP) covers loading, Interaction to Next Paint (INP) covers responsiveness, and Cumulative Layout Shift (CLS) covers visual stability. A page passes only when real visitors, at the 75th percentile, get a good result on all three.
You are in crowded company. A 2023 Chrome team analysis found that40% of sites in the Chrome UX Report did not meet the good LCP threshold. Most WordPress sites fail for a short list of reasons: a hero image the browser finds late, a slow server response, too much JavaScript, and content that loads in without reserved space. This guide shows you how to spot which one is yours, and how to fix it.
Core Web Vitals thresholds in 2026
Metric
What it measures
Good
Needs improvement
Poor
LCP
Loading
2.5 seconds or less
Up to 4 seconds
Over 4 seconds
INP
Responsiveness
200 ms or less
Up to 500 ms
Over 500 ms
CLS
Visual stability
0.1 or less
Up to 0.25
Over 0.25
What are the three Core Web Vitals in WordPress?
Core Web Vitals are field metrics. They come from real people on real devices, not from one lab test. Google gathers them through the Chrome User Experience Report (CrUX) and judges each metric at the 75th percentile. In plain terms, three out of every four visits need a good experience.
Largest Contentful Paint (LCP)
LCP is the time until the largest image, video poster or block of text in the viewport is painted. On most pages that is the hero image. Per the 2024 Web Almanac, as cited by web.dev, 73% of mobile pages have an image as their LCP element. So the hero image is where most WordPress LCP stories start. It is rarely where they end.
Interaction to Next Paint (INP)
INP replaced First Input Delay (FID) as a Core Web Vital in March 2024. FID only measured the delay before the first interaction began. INP watches every click, tap and key press during a visit, and reports a value close to the slowest one. That makes it harder to pass. If a guide still lists FID as a Core Web Vital, it is out of date.
Cumulative Layout Shift (CLS)
CLS scores how much visible content jumps around while the page loads. It has no unit. A score of 0.1 is a small amount of movement, not a tenth of a second. You feel CLS when you go to tap a button and it slides away.
How do you check Core Web Vitals on a WordPress site?
Start with field data, not a lab score. Open PageSpeed Insights, enter a URL, and read the real-user section at the top. If it says the page passes, move on. If it fails, note which metric is red. That one metric decides what you do next.
Then open the Core Web Vitals report in Google Search Console. It groups URLs that share the same problem, so you can fix a template once instead of chasing pages one by one. That matters in WordPress, because a single theme template or page builder layout often sits behind hundreds of URLs.
The Lighthouse score lower on the PageSpeed Insights page is lab data. It is useful for debugging, but it is one simulated visit. Lighthouse also cannot measure INP, because INP needs real interactions. Total Blocking Time is the lab stand-in. Treat it as a clue, not a verdict.
Test the pages that earn money, not only the homepage. A homepage can pass while a blog post, product page or checkout fails on mobile. When you ship a fix, click Validate Fix in Search Console, then be patient. The report is built from a rolling window of real visits, so expect to wait close to a month.
Which Core Web Vitals problem should you fix first?
First, find the failing metric in field data. Pick the metric that is furthest from its target, not the one that looks easiest. Second, name the cause with the right breakdown. For LCP, that is the four LCP subparts. INP, is the slow interaction and the script running during it. For CLS, it is the element that shifted. Third, change one thing. Fourth, retest, then repeat.
The one-change rule matters more than it sounds. When you ship five fixes at once, a better score tells you nothing about which fix did the work, and a worse score tells you even less.
Our own numbers point the same way. KrishaWeb’s WordPress team says some sites gain 20 to 40 Lighthouse points from a single change. That is a lab score and it varies by site. It does show how often one cause dominates, which is why the first move is to find it.
How do you improve LCP in WordPress?
Treat LCP as four stages that add up to one number. The web.dev optimization guide splits it into time to first byte (TTFB), resource load delay, resource load duration and element render delay. Most people attack the third one by shrinking the image. The Chrome data says the biggest losses sit elsewhere.
According to Chrome team analysis on web.dev, most origins with poor LCP spend less than 10% of their LCP time downloading the image. Among pages with poor LCP, the browser waits about 1,290 milliseconds at the 75th percentile before it even starts loading the LCP image. Note that this analysis dates from 2023.
Make the hero image easy to find and load first
Give the LCP image fetchpriority=”high” and make sure it is not lazy-loaded. Since version 6.3, WordPress tries to do this for you. It adds the attribute to the first large image on the page. Core contributors measured a gain of roughly5 to 10 percent in LCP in lab benchmarks.
The catch is that it is a rule of thumb. If your theme loads a big logo first, or a slider inserts the hero with JavaScript, WordPress can tag the wrong image, or none. View the page source, search for your hero image, and confirm it has fetchpriority high and no loading=”lazy”. The same Chrome analysis found that 35% of image LCP elements were not discoverable in the initial HTML. A normal img tag, or a preload, fixes that.
Cut server response time
TTFB is dead time. Nothing paints until the HTML arrives. Inweb.dev’s breakdown, origins with good LCP had a TTFB near 600 milliseconds at the 75th percentile. Origins with poor LCP sat near 2,270 milliseconds. Page caching is the usual fix on WordPress, and a host with server-level caching helps more than a plugin alone. A CDN helps visitors who are far from your server. When you test, add a throwaway query string such as ?test=123, because a CDN can hide a slow origin.
Shrink the file, then check what blocks the paint
Serve WebP or AVIF, size images to the layout with srcset, and compress them. Then look at render-blocking CSS and JavaScript. Web.dev warns that if you shrink the image alone, the time you saved can simply reappear as render delay. If the image arrives early but the page is not ready to show it, the visitor still waits.
What this looked like on two KrishaWeb builds
On theBattle Royal Studios website, a WordPress build on a custom lightweight theme, PageSpeed Insights showed LCP falling from about 5.1 seconds to 1.4 seconds. The mobile score rose from about 41 to 91. On the KrishaStudio website, LCP went from about 5.4 seconds to 1.3 seconds, and the mobile score from about 43 to 90.
Be clear about what those numbers are. They are rounded lab results from PageSpeed Insights, published in our own case studies, not field data. Both builds used a custom theme with no page builder. The Battle Royal Studios case study also lists purged Tailwind CSS, optimized image formats, deferred scripts and a font-display setting. It does not isolate which change moved LCP most, so I will not claim one did.
How do you fix INP in WordPress?
INP is about the main thread. When JavaScript is busy, the page cannot respond to a tap. Web.dev calls any task over 50 milliseconds a long task, and long tasks are what make interactions feel stuck. Every interaction has three parts: input delay, the time your event handlers take, and the presentation delay before the next frame appears. The fix depends on which part is slow. On WordPress, the usual suspects are rarely the theme. They are the scripts added on top: chat widgets, tag managers, ad scripts, heatmaps, sliders, and plugin scripts that load on every page whether or not the page needs them. Open Chrome DevTools, record a Performance trace while you click the slow element, and see which script owns the long task.
Then work in this order. Remove what you do not need. Load what is left only on the pages that use it. Delay non-critical scripts until the page is usable. Web.devalso recommends yielding to the main thread so long tasks get broken up. The scheduler.yield() API does this, but check support first. At the time of the web.dev guide, Safari did not support it. Keep your DOM small too, since large page builder layouts make every layout update more expensive.
Plugin count is a poor warning sign. One badly built plugin can cost more than ten lean ones. Look at what each plugin loads and runs on the page, not how many are installed. Old, unused tags in a tag manager are worth a clean-out for the same reason.
The Battle Royal Studios build shows how much main-thread work a lean setup can remove. Total Blocking Time fell from about 680 to 90 milliseconds. TBT is the lab stand-in for INP, not INP itself, and neither case study reports an INP number. So the honest reading is this: less blocking time is the right direction, and a field INP check is what confirms it.
How do you fix CLS in WordPress?
CLS is the easiest of the three once you find the element that moves. In PageSpeed Insights, open the layout shift diagnostics and note which element shifted. Almost every case comes down to content that arrives without reserved space.
Give every image and video a width and height, or a CSS aspect-ratio, so the browser holds the space before the file loads. WordPress usually adds dimensions to images inserted in the editor, but theme and page builder images often miss them. Reserve a fixed-height slot for ads, embeds and comment widgets. Push late banners, such as cookie notices and promo bars, into space that already exists instead of letting them push the page down.
Fonts count too. When a web font swaps in, text can reflow. Preload your main font, set a sensible font-display value, and pick a fallback font with similar proportions.
Why do Core Web Vitals fail when you already have a caching plugin?
Caching speeds up the HTML. It does nothing for a heavy hero image, a slow third-party script, or a layout that shifts. That is how a page can feel fast in a quick test and still fail in the field. Match what you see to the most likely cause below.
What you see
Likely cause
Fix to try first
LCP over 4 seconds
Hero image found late, slow server, or blocked rendering
Check TTFB, then add fetchpriority high to the hero and remove lazy loading from it
INP over 500 ms
Long JavaScript tasks or heavy event handlers
Trace the slow click in DevTools, then remove or delay the script that owns the task
CLS over 0.25
Images or embeds without dimensions, late banners, font swaps
Set width and height or aspect-ratio, and reserve space for late content
Fails on mobile only
Heavy scripts and images on slower devices
Test with mobile throttling and trim what loads above the fold
Slow Elementor or builder pages
Large DOM, many widgets, extra CSS and JS per widget
Simplify the template, remove unused widgets, check assets loaded per page
Passes in lab, fails in field
Real devices and networks are slower than the test
Trust field data and test on a mid-range phone
Fails with caching on
Uncached pages, a slow origin, or script and render cost
Bypass the cache with a query string and find what the cache is not helping
Page builders deserve a closer look. Heavy templates create large DOMs, and each widget can add its own CSS and JavaScript. Remove widgets you do not use, flatten deeply nested containers, and check which assets load on each template. Most builders include settings for loading assets more efficiently. Test after each change, because aggressive options can break layouts.
Our own WordPress builds take a different route. Both the Battle Royal Studios and KrishaStudio sites use native Gutenberg with a custom lightweight theme and no page builder. The KrishaStudio case study calls that choice “the most consequential decision on the project.” A side benefit on Battle Royal Studios is that content edits need no developer help. If you already run Elementor, you do not need to rebuild. Audit one template at a time with the steps above.
Which WordPress tools and plugins help with Core Web Vitals?
Use diagnostic tools to find the problem and optimization plugins to apply the fix. These are options worth knowing, not tested winners. None of them passes Core Web Vitals on its own.
Tool
Best for
Watch out for
PageSpeed Insights
Field and lab data for one URL
The lab score is one simulated visit
Google Search Console
Groups of failing URLs and fix validation
It lags, because it uses a rolling window of real visits
Chrome DevTools
Finding the LCP element, long tasks and shift sources
Needs some technical comfort
WP Rocket
Page caching, plus CSS and JavaScript options
Aggressive JavaScript settings can break features
LiteSpeed Cache
Caching and optimization
Full benefits depend on a LiteSpeed server
Perfmatters
Turning scripts and assets off page by page
Easy to disable something a page needs
ShortPixel or Imagify
Compression and modern image formats
Does not fix a late-discovered or lazy-loaded hero
Cloudflare
CDN and edge caching
Can hide a slow origin during tests
Pick one caching plugin and one image tool. Two plugins doing the same job often fight each other. For a wider look at speed beyond these three metrics, read our AI-powered WordPress speed guide.
For reference, our WordPress team lists Lighthouse, Query Monitor, a Redis object cache, WebP images with srcset, and conditional asset loading in its performance toolkit. Conditional loading means scripts and styles are enqueued only on the pages that need them. That is a set of habits as much as a set of products.
Do Core Web Vitals affect Google rankings and revenue?
Yes, but less than most guides claim. Google uses Core Web Vitals in its ranking systems, and Google Search Central is clear that good scores do not guarantee top rankings. Relevance and helpful content still come first. Think of Core Web Vitals as a tiebreaker in search and a real lever on conversions. The stronger case is revenue. Milliseconds Make Millions, a study Google commissioned from Deloitte Digital, followed 37 brands over four weeks. A 0.1 second gain in mobile site speed lifted retail conversion by 8.4% and The stronger case is revenue. Milliseconds Make Millions, a study Google commissioned from Deloitte Digital, followed 37 brands over four weeks. A 0.1 second gain in mobile site speed lifted retail conversion by 8.4% and travel conversion by 10.1%. Two caveats apply. The study dates from 2020, and it measured older speed metrics, not today’s Core Web Vitals. Use it as direction, not as a promise.
Do Core Web Vitals matter for AI search?
There is no confirmed link between passing Core Web Vitals and being cited in an AI answer, and I would not sell it that way. What I can say is narrower, and still useful. AI search tools need to fetch and read your page. A slow page that hides its text behind JavaScript can be harder to fetch and parse than a fast page serving clean HTML. And a visitor who clicks through from an AI answer has the same patience as anyone else.
AI can also speed up your diagnosis. Paste the PageSpeed Insights opportunities into an assistant and ask for a plain-language summary of likely causes. Then confirm each suggestion in DevTools before you change anything. Assistants will happily recommend fixes that do not fit your theme.
WordPress Core Web Vitals checklist
Check field data in PageSpeed Insights and Search Console, mobile first.
Fix the worst failing metric before the others.
Confirm the hero image is in the HTML, is not lazy-loaded, and has fetchpriority high.
Measure TTFB with caching on, and again with a cache-busting query string.
Remove scripts, or restrict them to the pages that use them.
Add width and height, or aspect-ratio, to every image and embed.
Reserve space for ads, banners and cookie notices.
Use one caching plugin and one image tool.
Change one thing at a time, then click Validate Fix in Search Console.
Need help fixing Core Web Vitals on your WordPress site?
What is a good Core Web Vitals score for WordPress?
Core Web Vitals are not a single score. A page is good when LCP is 2.5 seconds or less, INP is 200 milliseconds or less, and CLS is 0.1 or less, measured at the 75th percentile of real visits. Google assesses mobile and desktop separately, so check both. A high Lighthouse performance number is a different thing, and it does not mean you pass.
How do I fix failed Core Web Vitals in WordPress?
Find the failing metric in PageSpeed Insights field data or Search Console. Then diagnose the cause: the LCP subparts, the slow interaction for INP, or the shifting element for CLS. Fix one cause at a time, retest, and use Validate Fix in Search Console. Most WordPress failures trace back to a late or lazy-loaded hero image, slow server response, heavy JavaScript, or content that loads in without reserved space.
Which WordPress plugins help improve Core Web Vitals?
Caching plugins such as WP Rocket or LiteSpeed Cache, asset managers such as Perfmatters, and image tools such as ShortPixel or Imagify cover most needs. Choose one caching plugin and one image tool, because overlapping plugins often conflict. None of them guarantees a pass, and aggressive JavaScript settings can break features, so test each change on mobile.
Why do PageSpeed Insights and Search Console show different results?
PageSpeed Insights shows real-user data for one URL plus a Lighthouse lab test of one simulated visit. Search Console groups many URLs using real-user data over a rolling period, so it trails behind your fixes. Lab and field numbers often disagree because real visitors use different devices and networks. Trust field data for pass or fail, and use lab data to find causes.
Does lazy loading hurt LCP?
It can. Lazy-loading the LCP image delays it, because the browser waits before fetching it. Lazy-load images below the fold, but load the hero image eagerly and give it fetchpriority high. WordPress tries to skip lazy loading on the first image automatically, so check your page source to confirm it picked the right one.
How long do Core Web Vitals improvements take to show in Search Console?
Expect close to a month. The data comes from real visits collected over a rolling window, so older slow visits age out gradually. Click Validate Fix after you ship the change, and avoid stacking other large changes during that period, so you can tell what worked.
Ready to Scale Your Agency?
Tell us what you are trying to deliver. Schedule a call to talk it through, or contact us with your project.




 KrishaStudio
 KrishaStore