In our interconnected business world, your website serves as the digital foundation for your organization’s success. So, when senior executives say, “Just tell us how much we should spend on website design & development,” the answer involves a complicated ecosystem which integrates visual design with technical functionality, and the potential opportunity for a 250% to 1400% return on investment over a 2-to-4 year operation cycle.
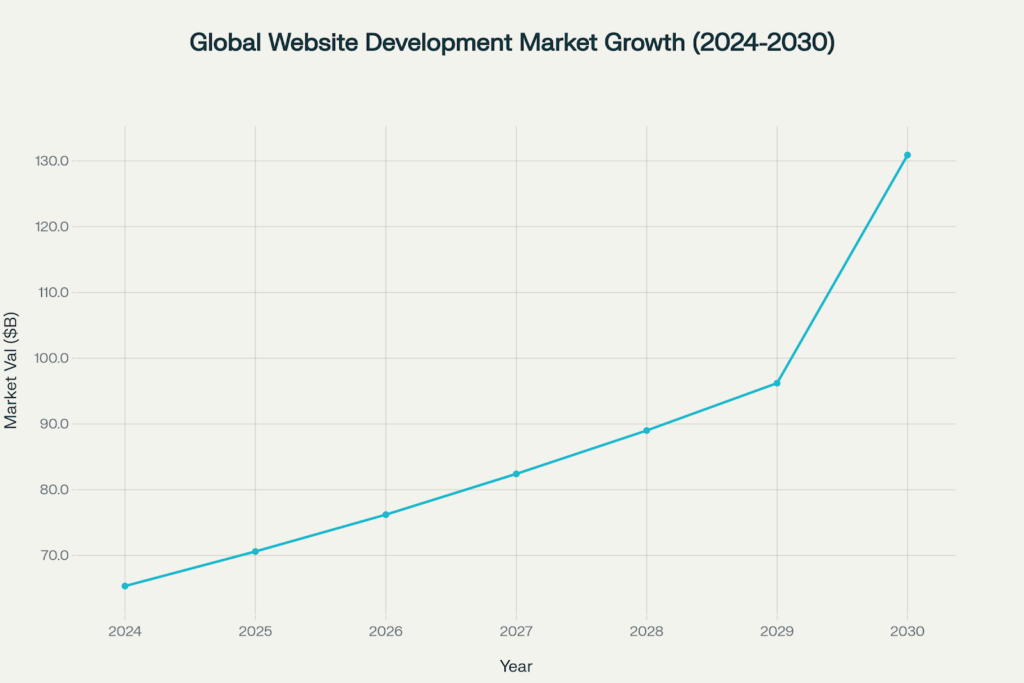
The overall investment in both website design cost and website development cost isn’t simply about developing your online presence; it’s creating a digital asset to build a revenue stream, improve operational efficiencies, and establish competitive differentiation. As the global web development market grows to $89.2 billion by 2028 with a 14.7% CAGR through 2030, and with 94% of first impressions design-related, understanding web development cost becomes mission-critical for executive decision-makers.
This exhaustive resource serves C-level leaders to take a strategically focused approach to assessing joint design and development costs to ensure spent resources are optimized and tied to clear business objectives. (Source: CXL, Business Research Insights)
The global website development market is projected to double from $65.35B in 2024 to $130.9B by 2030, presenting significant business opportunities for strategic investment
Understanding the Costs of Integrated Design and Development
It is common for modern projects addressing website expansion to require fusion between visual design and technical development. The Blacksmith Agency found that 75% of users judge a company’s credibility based on its website design, and Mordor Intelligence claims technical development capabilities drove 9.30% CAGR growth in the web development market.
The Realities of the Design-Development Integration
Websites are successful when investment is equilibrated across both disciplines.
Design components (30-40% total budget):
UX (user experience) research and strategy
UI (user interface) design and visual identity
Information architecture and content strategy
Responsive design for multi-device utilization
Brand integration and visual storytelling
Prototyping and user testing
Development components (60-70% total budget):
Front-end programming and technical implementation
Third-party API connections and systems integration
Security implementation and performance optimization
Quality assurance and testing protocols
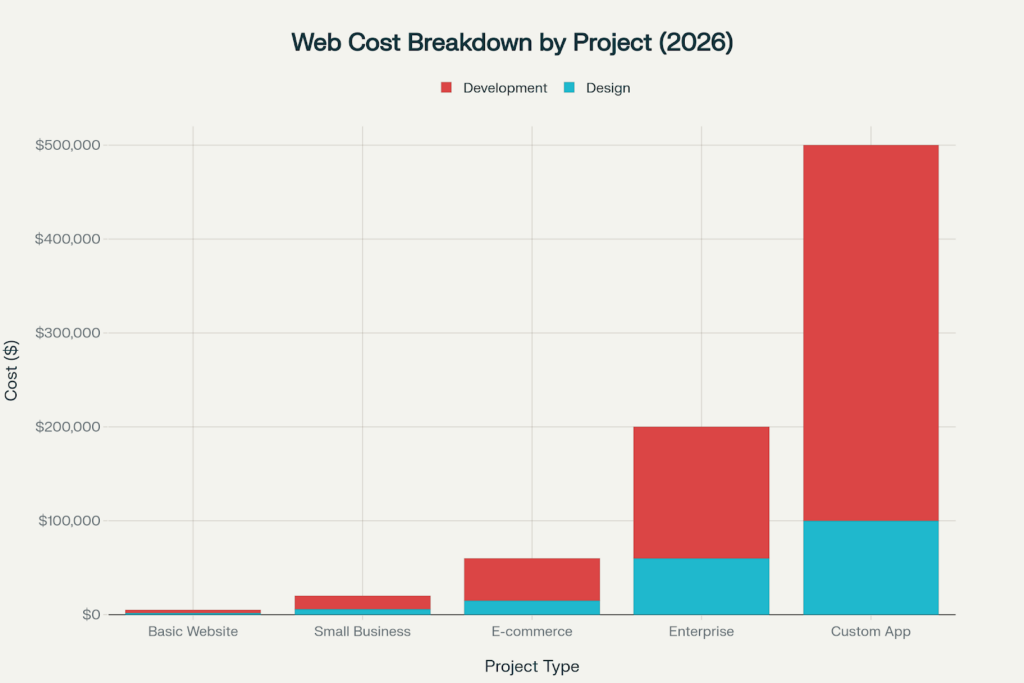
Website projects require balanced investment in both design and development, with development costs typically representing 60-70% of the total project budget across all complexity levels
Cost Analysis Based on Project Complexity
Tier 1: Business professional website (pricing range $2K – 8K)
Design Costs: $800 – $2,000
Brand analysis plus market research on competitors
Custom User Interface design of (5 – 10 total pages)
Mobile-responsive design framework
Baseline UX optimization
Style guide and design system creation
Development Costs: $1200 – $6,000
Frontend web development using modern frameworks
Content Management System set-up
Basic SEO, performance speed optimization
Contact form, lead capture, etc.
Social Media integration, analytics integration, etc.
Strategic Value Proposition:
According to research from Esparkinfo, 70% of small businesses do not have an effective call-to-action on their website. The company that has created a professional website for their services with call-to-actions should expect a return on investment (ROI) in credibility in the marketplace, as well as client lead generation, in the market range of 200 – 300% ROI.
Moveworks research shows that a strategic digital investment in this category will see a return on investment of 200-500% leveraging lead generation, conversion rate improvement, and operational efficiency.
Investment Breakdown:
Discovery and Strategy: $1,200-4,000 (15% of budget)
Design Phase: $2,000-12,000 (30% of budget)
Development Phase: Usually $6,000-28,000 (60% of budget)
Testing and Launch: $800-2,000 (10% of budget)
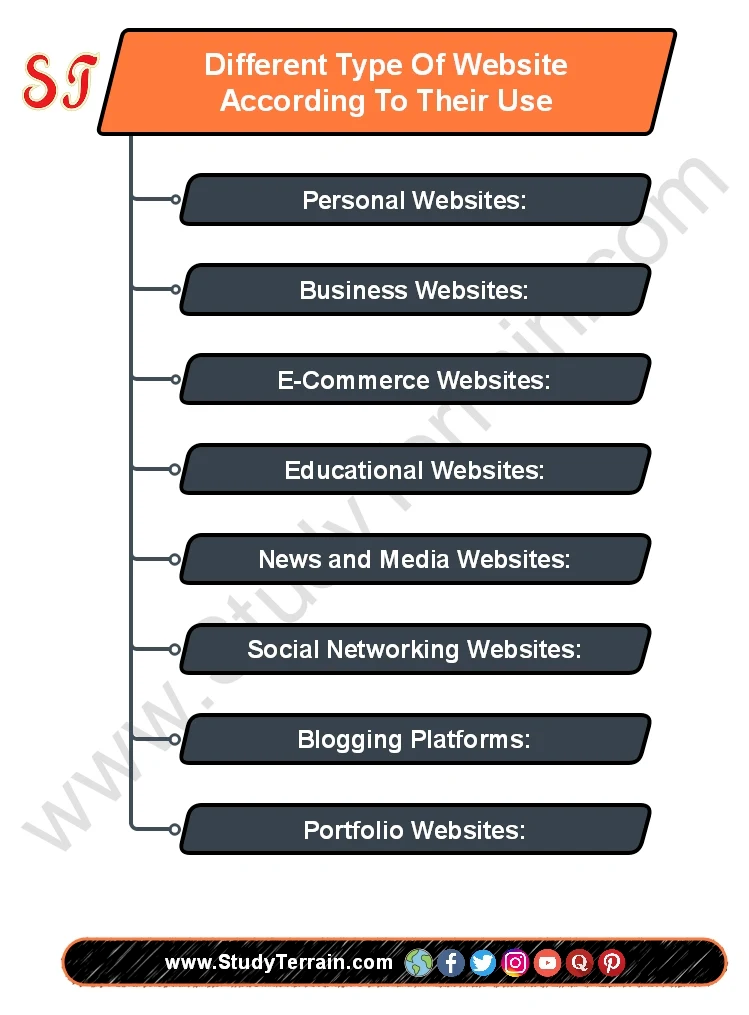
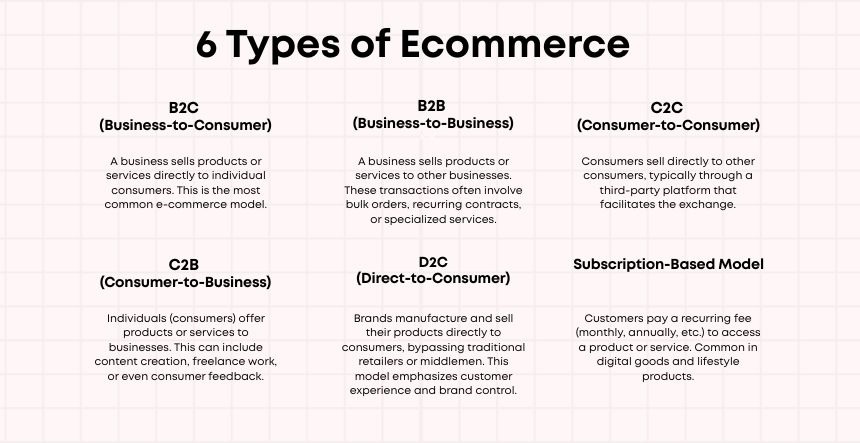
Types of websites categorized by their use, including personal, business, e-commerce, educational, news, social networking, blogging, and portfolio sites (Source: studyterrain)
Tier 3: Enterprise Digital Platforms ($40,000 – $250,000)
Design Investment: $15,000 – $75,000
Enterprise-level UX research and journey mapping
Complex information architecture and wireframing
Advanced UI design with custom interactions
Multi-brand and multi-site design systems
Accessibility compliance and inclusive design
Development Investment: $25,000 – $175,000
Enterprise-level architecture and scalability
Advanced system integrations (ERP, CRM, BI)
Custom API development and microservices
Advanced security and compliance
Performance optimization for high-traffic situations
Enterprise Strategic Returns:
The Market.us analysis describes that large enterprises capture 68.4% of the market due to complex requirements, producing 400-700% systemic return on investment through operational transformation and competitive advantage.
The Total Investment Summary:
Discovery and Strategy: $6,000-25,000 (15% total)
Design Phase: $15,000-75,000 (30% total)
Development Phase: $25,000-175,000 (60% total)
Testing and Launch: $4,000-15,000 (10% total)
Tier 4: Custom Digital Solutions ($100,000-500k+)
Design Investment: $30,000-150,000
Extensive user research & behavioral research
Custom design systems & component libraries
Advanced interaction design & micro-animations
Multi-platform design coordination
Innovation user experience methodologies
Development Investment: $70,000-350,000+
Full-stack custom application development
Proprietary algorithm and AI implementation
Advanced data processing and analytics layer
Custom infrastructure and dev ops implementations
Intellectual property and patent-worthy innovations
Innovation Returns:
Increasingly, Digital Transformation Research from several large consultancies shows that custom will deliver ROI (600%-1200%), proprietary, new revenues, and competitive weeping of complex requirements.
Geographic Cost Assessment (Hourly Rates)
Region
Hourly Rate
Market Share
Best For
North America
$140-280/hr
38.2%
Compliance-heavy
Western Europe
$110-200/hr
27.5%
GDPR projects
Eastern Europe
$65-120/hr
Fastest growth
Cost/quality balance
India (Tier 1)
$40-90/hr
18.4% CAGR
Scalable enterprise
Geographic and Resource Allocation Approaches
Global Development Cost Assessment
North America Teams ($100-200/hour)
Market Share: 36.8% of global revenue (20.28 billion) Market.us
Design Expertise: Best-in-class UX research and brand strategy
Development Strength: Enterprise architecture and compliance
Best For: Complex projects requiring cultural alignment and compliance with regulations
European Partners ($80-150/hour)
Market Position: 28% global market share with strong technical capabilities
Development Focus: Scalable & AI-integrated applications
Best For: High-volume projects with long development cycles.
Investment Frameworks Tailored to Industry
Healthcare Digital Transformation ($25,000 – $200,000)
Sector Expansion: Education around Healthcare web development is projecting a 14.60% CAGR driven largely by the telemedicine requirements and digital health demand, according to Mordor Intelligence.
Design Scope (30% of budget):
Design the UI with a HIPAA compliance lens
Optimize the patient portal experience
Ensure web accessibility for a diverse patient population
Strategize IA and content for medical information
Development Scope (70% of budget):
Architect backend with HIPAA compliance lens
Integrate with Electronic Health Record (EHR)
Build telemedicine capability and secure communications
Develop payment and insurance systems
ROI Drivers:
Attract patients by building a credible online presence
Automate appointment booking and engage in greater operational efficiency
Diversify revenue and services through telehealth
Illustrate risk mitigation internally and externally through compliant and secure systems
Financial Services Digital Platforms ($40,000 – $300,000)
Design Budget Focus:
Trust, trust, trust: not everyone will see the same screen, or even if they do, trust the same page…75% of people will judge your credibility based on design (Resource: blacksmith)
Customer secure portal interfaces
Data visualization design and dashboard
Design with a mobile-first eye towards banking applications
Development Budget Implementation:
Advanced security architecture and fraud prevention
Integrate with core banking systems
Regulatory compliance (SOX, PCI-DSS, or Basel III)
Real-time transaction processing capacity
Strategic Business Value:
Customer acquisition by enhancing digital trust in the organization
Reduce operational costs through service automation
Mitigate risk through advanced security controls
Differentiate from competition by building a better user experience
Manufacturing and B2B Digital Solutions ($30,000 – $400,000)
Design Approach:
Multi-faceted product catalog and configurator interfaces
B2B user experience design focused on procurement processes
Consolidation of technical documentation and resources
Approval workflow design for multiple stakeholders
Development Framework:
According to market.us, Web Development Frameworks have 34.6% of the market share because of their ease of building scalable B2B applications:
ERP and inventory management system integration
An engine for generating personalized pricing and quotes
Partner portals and supply chain visibility
Advanced analytics and business intelligence software
Advanced Technology Integration Expenses
Artificial Intelligence and Machine Learning Integration
Design Elements ($5,000 – $25,000):
AI-based personalization interface design
Chatbot and conversational UI design
Data-based insights and analytics visualization
Predictive optimization of user experience
Development Cost ($15,000 – $75,000):
By 2025 end, Blacksmith Agency estimates that 75% of businesses will use AI-based web technologies. (Source: Backsmith Agency)
Create custom machine learning models
AI-based content recommendation engines
Predictive analytics and business intelligence
Natural language processing and automation
Businesses impacted:
AI-powered chatbots save a business’s staff 60% on customer support (Source: Backsmith Agency)
Personalizing content increases session length by 35%
Micro-interactions can increase engagement by 40%
Utilizing AI chatbot software has been shown to improve customer support efficiency by 60%
Curated/Personalized Content has been shown to increase average session duration by 35%
Use of micro-interactions hasbeen shown to increase user engagement by 40%
Development of Progressive Web Applications (PWAs)
The following costs apply to each phase of developing and building a PWA:
Design Activities ($8,000 – $30,000)
Design of the app-like interface and user experience (UX)
Design of the offline/system performance optimization
Design of the engagement strategy and push notifications features.
Design features for cross-device consistency and responsiveness.
Optimization and strategies for a performant app-like experience.
Strategic Benefits of Building a Progressive Web App:
Development costs are lower than native app alternatives
Higher user engagement and retention
Improved page performance with quicker speeds
Cross-device design without the complications of app store structures.
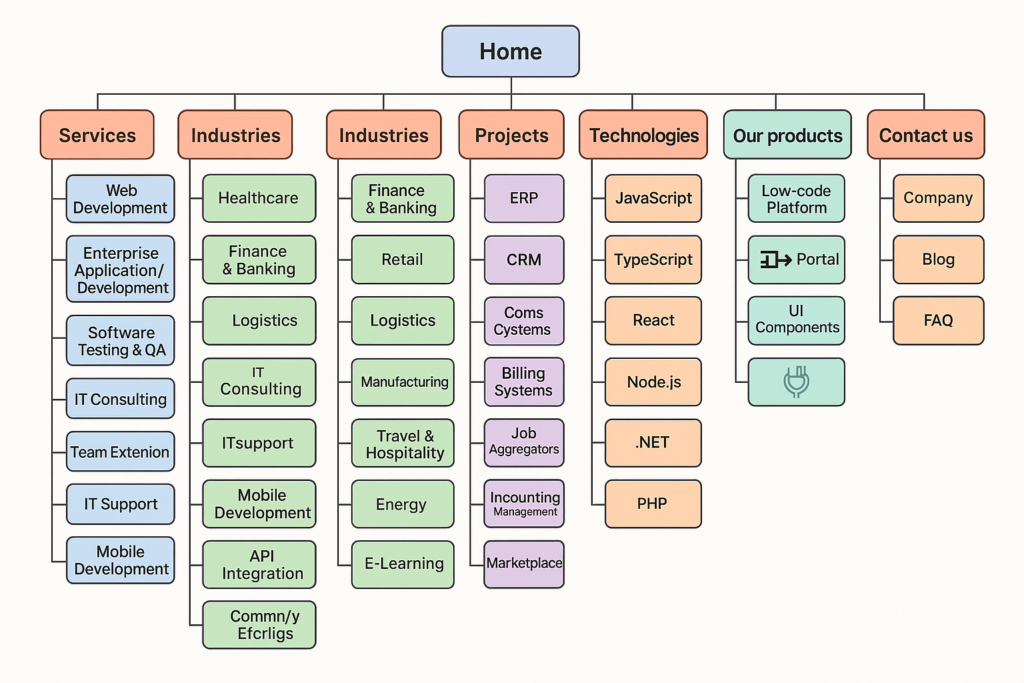
A comprehensive sitemap of a software development company’s services, industries, projects, technologies, products, and informational sections relevant to the website development process.
Financial Planning and Optimization of Return on Investment
Integrated Budget Allocation Model
Phase 1: Discovery and Strategy (10%-15% of total budget)
Based on Research in Executive Decision-Making 2023: (Resource: Fuld & Company)
Analysis of business requirements/needs/discussions and alignment with stakeholders
User research and assessment of the competitive landscape
Technical architecture planning and strategy for technical integration
Establishment of a design strategy and framework for brand alignment
Phase 2: Design Development (25%-35% of total budget)
Design Capability Review: UX methodology/approach, creative talent, and alignment to brand
Project Management Capability: delivery method, communication plan, risk management plan
Strategic Partnership Capability: long-term partnership capability and support of growth
Optimization of Engagement Model
Market Research Analysis Findings
Integrated Design-Development Teams: Single vendor accountability, with full capability for design and build-out.
Specialized Partnership Models: Best-of-breed design and development specialists, with coordinated delivery, harnessing
Hybrid Approaches: Strategic phases with different vendors optimized for specific capabilities
Future-Proofing Investment Strategy
Technology Trend Integration
Emerging Design Trends (2026-2030) According to Mordor Intelligence, core growth drivers are identified over the next five years:
AI-powered personalization (impact on CAGR +1.4%)
Inclusive and accessible design (regulatory requirement)
Voice user interface (hands-free)
Augmented reality (AR)
Development Innovation Areas
Headless CMS and composable architectures (impact on CAGR +1.2% )
Edge Computing Blockchain Integration
IoT Connections Omnichannel digital experience
Scalability and evolution plans
Architecture Scalable considerations:
Cloud-native development, already 63.9% of the market (Market.us)
Microservice architecture with component-based scaling
API-first design for ecosystem integration
Performance optimized for a global user base
Continuous improvement plan
Annual enhancement budgets of 15-25% of the original investment
Feature development roadmap, at a minimum, quarterly
Feedback to inform the design process, including UX Continuous
Technology refresh every 3-4 years for major updates to each service, for both back diligence improvements to service capacity and future needs
Conclusion: Strategic Investment in Integrated Design and Development
The integration of design excellence and technical innovation enables innovative pathways of strategic business value creation. Business Research Insights forecasts that the market will reach a projected $165.13 billion by 2035. As per Blacksmith Agency research, 94% of first impressions are based on design-related considerations.
Executive Strategic Imperatives:
Integrated Investment Strategy: A strategic investment of design and development must be aligned with a typical investment ratio of 30:70 user experience to technical capability
ROI Driven Decision Making: Use the ROI framework provided by Moveworks, which reports returns ranging from 200-1200% in every investment category. (Source: Moveworks)
Market Driven Resource Allocation: Take advantage of Mordor Intelligence growth estimates that report a 9.30% CAGR growth based on AI integration and composable architectures. (Source: Mordor Intelligence)
Risk-Adjusted Investment Roadmap: Acknowledge the PwC report findings, which state that 92% of technology investments don’t meet expected benefits because they are not made strategically. (Source:Whatfix)
Future Proof Architecture Selection: Invest in solutions that are scalable and future-proof to support the Market.us forecast that cloud-based solutions will dominate at 63.9% market share. (Source: Market.us)
The Strategic Bottom Line: A comprehensive investment of $75,000 into integrated design and integrated development creates $375,000 of business value over three years (400% ROI) that noticeably exceeds fragmented investment methods that do not identify outcomes.
KrishaWeb provides integratedweb designand web development solutions that ensure your business realizes maximum strategic value through proven methodologies and industry expertise with validated ROI frameworks. Our consulting methodology is executive-driven and sources experience that can prove that your digital investment strategy aligns with business intent and, while doing so, ensures an ongoing sustainable advantage.
Are you ready to explore ways to invest in your digital business strategy with design and development? Reach out to KrishaWeb today to book your executive consideration of integrated solutions and ROI optimization for long-term value.
Frequently Asked Questions
What is the best allocation ratio of design % to development%?
Research suggests allocating between 30-40% of the budget to design and 60-70% of the budget to development. Blacksmith Agency reported that 75% of users rate credibility based on design, while Mordor Intelligence reported a – 9.30% CAGR based on the demand for custom technical capabilities 75% of users want credibility based on design. However, in the end, the right allocation will go to meet your objectives for your user experience journey.
How do I know the design and development teams will engage and think together?
Research on Executive Decision-Making describes integrated project management processes. Follow an Agile methodology and approach to the design and development project processes, have the team approach collaboratively concerning cross-disciplinary project management, always applying design systems together, and touch base with stakeholders continuously throughout the process. An engagement of one vendor often works better concerning deliverables than managing two contracts for design and development.
What is the business rationale for investing in premium design as well as premium development?
An ROI analysis by Moveworks shows that the quality of a combination of design and development that is integrated provides returns ranging from 300-1200%. 94% of first impressions are related to design (Blacksmith Agency). Robust development is important after design, as 53% of mobile users who visit your site will abandon it if there is a delay in loading time. Additionally, by combining investment in design and development, you can also avoid the 92% failure of technology implementations that are poorly planned (PwC).
Should we stage design or development if we are on a constrained budget?
You should never sacrifice the experience of functionality or the experience of aesthetics within the user experience. By 2023, Mordor Intelligence reports that developer costs increased 40%+ since the onset of COVID-19, underscoring the importance of having the investment early. To manage design and develop budgets, consider needing functionality first and foremost, then use the minimum viable product model – think of it as a phase-based approach where you plan for minimal functionality and a professional design on commercial terms in phase one, and then grow and develop again based on where the user community is.
How do we measure success across the design and development outcomes?
User experience metrics are those such as engagement, conversion, and satisfaction, Technical performance includes metrics related to load times and period of uptime, or downtime, and security. Business outcomes mean things such as lead generation, revenue attribution, and cost savings. According to research done by Deloitte, only 19% of organizations measure their holistic outcomes; don’t be one of the 81% that miss the strategic value for your organization.
Disclaimer:The cost estimates presented in this guide are estimates of approximate cost based on 2026 market conditions. The actual cost for a website design will vary depending on project size, complexity, technologies, and location. The information above is not meant to be a quote. Please reach out to a web design agency for a precise quote on your project. No liability is assumed for any action taken based on this information.
Nisarg Pandya
Project Manager
Experienced Project Manager and Scrum Master at KrishaWeb, delivers expertise in Scrum methodologies, Laravel, React.js, UX design, and project management, ensuring efficient project delivery and agile implementation.