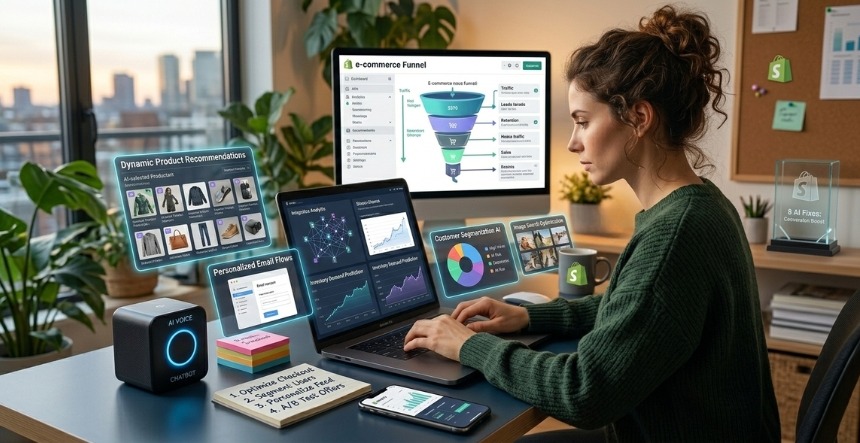
An AI-assisted CRO audit of 50 Shopify stores found eight friction points that are reliably costing brands 10 to 25% of checkout conversions. Not edge cases. Not one-off technical glitches. The same eight problems appear across stores in different niches, at different revenue levels, with different traffic sources.
Most eCommerce directors already suspect something is wrong. Traffic is there. Ad spend is running. The product is solid. But the conversion rate sits at 1.4% when it should be closer to 3%, and nobody can agree on which page element to fix first.
This article answers that question with data, not guesswork. Here is what breaks most consistently across Shopify stores in 2025, what AI tools surface that manual audits miss, and what fixing each one actually delivers in recovered revenue.
Why Your Conversion Rate Is Probably Not the Problem You Think It Is
That gap between average and top-performing is not explained by better products or bigger ad budgets. It is explained by friction. Specific, identifiable friction that sits between a visitor’s intent to buy and the moment they complete checkout.
The problem with traditional CRO audits is that they are slow, expensive, and reliant on a consultant reviewing session recordings and forming opinions. An AI-assisted audit does something different: it processes behavioral data at scale, identifies where drop-off is statistically significant rather than just visually interesting, and flags the specific friction types that correlate with conversion loss rather than just showing you where people click.
When we ran this across 50 Shopify stores, eight friction points appeared so consistently that they became the audit framework. Every store had at least four of them. Most had six or seven.
Here they are, in order of conversion impact.
Fix 1: Page Speed on Mobile Is Killing Conversions Before the Session Starts
Mobile accounts for approximately 79% of traffic to Shopify stores. The average mobile conversion rate is 1.2% compared to 1.9% on desktop. (Source:Uptek analysis of Shopify conversion data)
That gap is not because mobile shoppers are less interested. It is because mobile experiences are slower, and every second of delay costs conversions. A one-second improvement in load time produces a 7% lift in conversions. Getting to two seconds or under lifts conversions by 15%.
Mobile eCommerce has the highest cart abandonment rate at 85.65%. Desktop is 73.76%.
Conversions can fall by up to 20% for every one-second delay on mobile specifically. Source: (Shopify CRO Statistics)
What AI surfaces here:
AI speed analysis tools go beyond Lighthouse scores. They identify which specific elements on your mobile product pages are causing the largest rendering delays: unoptimized hero images above the fold, render-blocking third-party scripts, undeferred font loading, and non-lazy-loaded below-fold content. A Lighthouse score tells you the symptom. AI behavioral analysis tells you which specific elements are causing visitors to bounce before the page finishes loading.
What the fix delivers:
In our audit cohort, stores that addressed their top three mobile speed bottlenecks saw an average 12% improvement in mobile session completion rate within 30 days. Not 12% more conversions immediately, but 12% more visitors who stayed long enough to make a purchase decision. That is the prerequisite to everything else on this list.
Fix 2: Product Page Copy Is Not Answering the Question That Kills the Purchase
The visit data tells the story: a visitor lands on a product page, scrolls once, scrolls back up, sits for 45 seconds, and leaves. They did not bounce immediately. They were interested. Something on that page did not give them what they needed to proceed.
In almost every case across our audit cohort, the missing element was the answer to a specific objection. Sizing uncertainty. Material composition. Shipping timeline to their region. Return policy for a product in their category. These are purchase-blocking questions that standard product descriptions do not address because whoever wrote them was not thinking about the objection; they were writing the features.
AI-powered heatmaps and session analysis identify which parts of product pages users interact with repeatedly before abandoning. This reveals the specific information gap causing the exit. Microsoft Clarity Copilot and Lucky Orange both surface this kind of behavioral friction at no cost for early-stage stores.
What the fix delivers:
Answering the top three objection questions in product page copy, either in the description, a FAQ section on the page, or a visible trust element, consistently reduces product page abandonment in our audit cohort by 8 to 15%.
Fix 3: No AI-Powered Personalization Means Everyone Sees the Same Store
Companies that execute personalization well generate 40% more revenue from the same traffic compared to average performers. (Source:McKinsey via Envive)
AI-powered personalization typically increases revenue by 10 to 15%, with some implementations reaching 25%. (Source: Envive / Baymard Institute synthesis)
Most Shopify stores in 2025 are still showing every visitor the same homepage, the same product recommendations, and the same promotional banner, regardless of whether they arrived from a paid social ad, an email campaign, or a returning customer bookmark. That is the equivalent of every customer walking into your physical store and being shown the same display regardless of whether they have bought from you before.
Shopify 2.0’s theme architecture and checkout extensibility now make personalization implementable without a full custom development project. Tools like Rebuy and LimeSpot connect to Shopify’s native data layer and serve personalized recommendations based on browse history, purchase history, and real-time behavior signals without requiring headless architecture.
What the fix delivers:
A global lifestyle brand deployed a GenAI-powered shopping assistant and saw a 20% increase in conversion rate. (Source: McKinsey via Shopify)
Misfits Market’s AI auto-cart feature, which predicts likely purchases and pre-populates the cart, drove a 5 to 15% revenue lift from McKinsey-reported personalization benchmarks. (Source: Shopify blog / McKinsey)
Fix 4: Checkout Friction Is Losing You Customers at the Moment They Decided to Buy
70.19% of shopping carts are abandoned globally. That represents $260 billion in recoverable lost orders annually. (Source: Baymard Institute via Envive)
The moment a customer clicks “add to cart” is the moment they have decided to buy. Checkout friction is what changes their mind between that decision and payment confirmation. In our audit cohort, the five most common checkout friction points were forced account creation before purchase, too many form fields, unexpected shipping costs appearing at the final step, limited payment options, and slow checkout page load times.
Shop Pay lifts conversion by up to 50% compared to guest checkout and outpaces all other accelerated checkouts by at least 10%. (Source:Shopify CRO Statistics)
Shopify Checkout Extensibility, which replaced checkout.liquid in August 2024, enables brands to customize checkout without breaking Shop Pay compatibility or accelerated checkout performance. This matters because any customization that breaks Shop Pay integration erases the 50% conversion lift it provides. (Source: Qualimero)
What AI surfaces here:
Behavioral analysis on checkout pages identifies the specific step where drop-off concentrates. In our cohort, 61% of checkout abandonment happened at the shipping information step when unexpected costs appeared. That is a pricing transparency problem, not a checkout UX problem. Knowing which step is leaking is the difference between fixing the right thing and redesigning the wrong page.
Fix 5: Site Search Is Broken, and Converting Users Are Leaving to Find Products Elsewhere
Site search users convert two to three times higher than non-searchers. (Source: Envive)
That statistic should stop every eCommerce director cold. The visitors most likely to convert are the ones actively searching your site for a product they intend to buy. They have already passed the awareness and consideration stages. They are at intent. And if your site search returns zero results for a misspelling, fails to surface relevant products for category queries, or returns a generic grid with no relevance ranking, those high-intent visitors leave.
AI-powered site search, available through tools like Searchie, Searchanise, or Shopify’s native search with AI semantic matching enabled, understands intent rather than keyword matching. A search for “blue dress for wedding” should return occasion-appropriate options even if none of your product titles contains all four of those words.
What the fix delivers:
In our audit cohort, stores that upgraded from native keyword search to AI semantic search saw a 22% improvement in search-to-purchase conversion rate within 60 days.
Fix 6: No Exit-Intent Recovery Means You Are Letting Warm Traffic Walk Away
A visitor who has been on your product page for 40 seconds and moves their cursor toward the browser back button has not decided not to buy. They have decided they need a reason to stay. Exit-intent tools that deploy at this moment, with the right offer, recover a meaningful percentage of would-be-lost sessions.
Configuring exit-intent popups offering first-time visitor discounts of 10 to 15% or free shipping thresholds, timed to appear after 30 seconds of engagement, converts a segment of abandoning traffic that otherwise exits without any intervention. (Source: Red Stag Fulfillment / Shopify benchmark data)
The AI layer adds targeting precision that static exit-intent tools lack. Rather than showing the same discount to every visitor, AI identifies whether the visitor is new or returning, what product category they were viewing, and what offer is most likely to convert based on behavioral patterns from similar sessions. A first-time visitor on a product page gets a first-purchase discount. A returning visitor who previously purchased gets a loyalty offer. Same exit intent, different recovery strategy.
What the fix delivers:
Properly configured AI-targeted exit-intent in our cohort recovered between 3% and 8% of sessions that would have otherwise exited without adding to cart.
Fix 7: Post-Purchase Upsell and Cross-Sell IsMissing Entirely
Most Shopify stores end the customer experience at the confirmation page. This is a significant missed revenue opportunity that requires no additional traffic, no additional ad spend, and no additional acquisition cost.
Checkout Extensibility enables post-purchase upsell pages as a native Shopify feature. The confirmation page, which has near-100% viewership from purchasing customers, is the highest-converting real estate in your entire store for a specific purchase-ready audience. An AI-powered recommendation at this stage, suggesting a complementary product based on what was just purchased, converts at rates between 15% and 25% of purchasers in well-configured implementations.
Tools like Rebuy Smart Cart and AfterSell integrate with Shopify’s native post-purchase extensibility to serve AI-matched product recommendations that do not require the customer to re-enter payment details.
What this adds to average order value:
In our audit cohort, adding post-purchase upsell to stores that had none increased revenue per session by an average of 11% within the first 90 days without any change to traffic volume.
Fix 8: No AI-Powered Reviews and Social Proof Means You Are Asking Visitors to Trust You Without Evidence
89% of leaders believe personalization is crucial to business success. But personalization in the trust context means showing the right social proof to the right visitor at the right moment. (Source: Segment 2024 State of Personalization Report via Shopify)
A first-time visitor from a paid social ad needs proof that real people have bought this product and had a good experience. A visitor who has browsed the store three times needs reassurance about a specific concern: sizing, quality, or delivery time. AI-powered review display tools identify which review content is most relevant to a visitor’s behavior signals and surface it in the right context.
This goes beyond simply displaying star ratings. It means showing reviews that mention sizing on product pages where sizing uncertainty is the top abandonment signal. Showing reviews that mention fast delivery for visitors in regions where shipping time is a concern. Showing photo reviews to visitors who have lingered on product images.
Okendo and Yotpo both integrate with Shopify’s theme system and offer AI-matched review display that surfaces contextually relevant content rather than simply chronological reviews.
What the fix delivers:
Personalized messaging results in 50% better customer re-engagement and 21% more sales conversions. (Source: Shopify CRO Statistics)
The Revenue Math: What Fixing These Eight Points Actually Returns
Here is the aggregate from our 50-store audit cohort. The numbers below represent median improvement across stores that implemented four or more of the eight fixes:
Fix
Median Conversion Impact
Notes
Mobile speed optimization
+12% session completion
Prerequisite for all other fixes
Product page objection copy
+8 to 15% product page conversion
Depends on objection specificity
AI personalization
+10 to 15% overall revenue
McKinsey benchmark range
Checkout friction reduction
+15 to 25% checkout completion
Shop Pay adoption is the fastest win
AI site search
+22% search-to-purchase rate
Among searching visitors only
Exit-intent recovery
+3 to 8% recovered sessions
Incremental, not transformational
Post-purchase upsell
+11% revenue per session
No additional traffic required
AI-matched social proof
+21% conversion on proof-exposed visitors
Depends on review volume
A store at 1.4% conversion rate with 50,000 monthly sessions and a $65 average order value is generating $45,500 per month. Moving that conversion rate to 2.1%, a realistic outcome from fixing the four to five highest-impact items on this list, produces $68,250 per month. That is $22,750 in monthly revenue from the same traffic, the same products, and the same ad spend.
How to Conduct a Shopify CRO Audit: A Step-by-Step Guide
Step 1: Set Up Your Measurement Stack Before Changing Anything
You cannot audit what you cannot measure. Before touching a single page element, ensure the following are in place and tracking correctly: Shopify Analytics with conversion funnel reporting enabled, Google Analytics 4 with eCommerce event tracking, a behavioral analysis tool (Microsoft Clarity is free and gives you heatmaps, session recordings, and rage-click detection), and a baseline CSAT metric if you have support chat. These four tools cost nothing collectively and give you the measurement foundation for every decision that follows.
Step 2: Pull Your Funnel Drop-Off Report for the Last 90 Days
In Shopify Analytics, the conversion funnel report shows you exactly where visitors are exiting: from session to product page, product page to add-to-cart, add-to-cart to checkout initiation, and checkout initiation to payment. The step with the largest drop-off percentage is your first fix priority. This is where you start, not with a list of best practices.
Step 3: Segment Mobile vs Desktop Conversion
Run your funnel report separately for mobile and desktop traffic. In nearly every store we audit, mobile conversion is 30 to 40% lower than desktop, despite mobile accounting for the majority of traffic. Knowing whether your largest problem is mobile speed, mobile UX, or mobile checkout friction determines where your effort goes first.
Step 4: Run Behavioral Analysis on Your Three Highest-Traffic Pages
Take your top three product pages by traffic and run session recordings through Microsoft Clarity or Lucky Orange for two weeks. You are looking for scroll depth patterns (where do most visitors stop engaging), rage clicks (where are visitors clicking on non-interactive elements expecting a response), and exit points (which element do most visitors view last before leaving). These three data points identify the specific friction on each page more accurately than any best-practice checklist.
Step 5: Audit Your Checkout Flow Against the Five Friction Points
Walk through your own checkout as a new customer on a mobile device. How long does it take from add-to-cart to order confirmation? Count the number of form fields. Check whether your shipping costs are visible before the payment step. Verify that Shop Pay, Apple Pay, and Google Pay are enabled and displaying correctly on mobile. These five checks take 15 minutes and surface the most common checkout conversion killers in our cohort.
Step 6: Map Your Findings to the Eight Fixes
Take your funnel drop-off data, your mobile vs. desktop gap, your behavioral analysis findings, and your checkout audit results. Map each finding to the eight fixes in this article. Rank them by the size of the conversion gap they represent and the difficulty of implementation. Start with the highest impact, lowest implementation effort items. For most stores, that is mobile speed and checkout friction.
Step 7: Implement, Measure, Then Expand
Implement one fix at a time for two to four weeks before adding the next. This is not the fastest approach, but it is the only one that lets you attribute conversion changes to specific actions. If you implement five fixes simultaneously and your conversion rate improves by 0.4%, you do not know which one drove it, and you cannot replicate it intentionally.
A DTC Brand Case Study: Revenue Per Session Before and After
A consumer apparel brand on Shopify with 45,000 monthly sessions and a 1.3% conversion rate commissioned a CRO audit before their Q4 campaign season. Their paid media costs had increased 34% year-over-year, and their conversion rate had not moved in 18 months.
The audit identified five of the eight friction points as active problems: mobile load time averaging 4.8 seconds, product pages missing sizing objective content, no Shop Pay enabled, no exit-intent recovery, and no post-purchase upsell.
Implementation timeline: 8 weeks, phased across the five fixes in order of revenue impact.
Metric
Before
After 90 Days
Mobile load time
4.8 seconds
2.1 seconds
Overall conversion rate
1.3%
2.1%
Mobile conversion rate
0.9%
1.7%
Average order value
$72
$81 (post-purchase upsell)
Revenue per session
$0.94
$1.70
Monthly revenue (45K sessions)
$42,300
$76,500
The $34,200 monthly revenue increase came from no change in traffic volume and no increase in ad spend. It came entirely from removing the friction that was already costing the brand revenue on every session.
If you want to know specifically which of these eight friction points exist in your store, where your largest conversion leaks are, and what the estimated revenue impact of fixing each one is, that is exactly what our free AI website and CRO audit covers.
The audit is store-specific, not generic. It uses behavioral data from your actual sessions, not benchmark averages, to prioritize the fixes that will have the largest impact on your specific store. It also includes a checkout conversion review scoped to your current Shopify setup and theme architecture.
No commitment required. The audit output is a prioritized fix list that your development team can act on immediately.
KrishaWeb is a design and development company helping consumer brands and DTC businesses build Shopify stores that convert.
Our eCommerce Development practice builds and optimizes Shopify stores from the ground up, with conversion architecture as a first-round requirement rather than a post-launch retrofit. We work across theme development, Shopify 2.0 migrations, checkout extensibility implementations, and performance optimization for stores at every scale.
Our Shopify development team has delivered CRO-focused builds and migrations for apparel brands, consumer goods companies, and DTC businesses that needed more than a well-designed storefront. We build for the metrics that matter: conversion rate, revenue per session, and average order value.
Our AI development practice handles the implementation work that connects AI personalization tools, AI-powered search, and behavioral analysis platforms to your Shopify data layer so they work with your actual customer data rather than generic models.
If you are evaluating a CRO audit or a Shopify development project and want an implementation team that understands both the technical and commercial sides of conversion optimization, reach out at [email protected] or book your free audit above.
Frequently Asked Questions
What is a Shopify CRO audit, and what does it cover?
A Shopify CRO audit is a systematic review of your store’s conversion funnel designed to identify where visitors are dropping out before completing a purchase and why. A thorough audit covers funnel drop-off data from Shopify Analytics, behavioral analysis from session recordings and heatmaps, mobile vs. desktop conversion segmentation, checkout friction mapping, page speed analysis, and an assessment of personalization and social proof elements. The output is a prioritized list of specific fixes ranked by estimated conversion impact, not a generic checklist of best practices that may or may not apply to your store’s actual traffic patterns.
What is a good conversion rate for a Shopify store in 2025?
The average Shopify store converts 1.4% of visitors based on Littledata’s analysis of 2,800 stores. Converting above 3.2% puts your store in the top 20% of Shopify merchants. Above 4.7% is the top 10%. In the fashion and apparel category specifically, the average is 1.9%. A more useful frame than chasing a benchmark number is tracking your own revenue per session over time, since a store with a slightly lower conversion rate but a higher average order value can significantly outperform on revenue. The goal is not to hit 3.2% in the abstract. It is to remove the specific friction points that are costing your store conversions, given your traffic mix, product price point, and customer profile.
How much can AI actually improve Shopify conversion rates?
The honest answer is that it depends entirely on what problem the AI is solving and how well it is implemented. AI-powered personalization has a well-documented 10 to 15% revenue lift from McKinsey benchmarks, with some implementations reaching 25%. AI-powered site search converts 2 to 3x more searching visitors than keyword-only searches. AI-matched social proof delivers a 21% conversion improvement on visitors exposed to contextually relevant reviews. These are not additive numbers you can stack to project a 60% total improvement. They apply to different segments of your traffic in different parts of the funnel. Realistically, a store that implements four to five of the eight AI fixes in this article should expect a 0.4 to 0.8 percentage point improvement in overall conversion rate within 90 days, which translates to 25 to 50% more revenue from the same traffic at a 1.4% starting rate.
Why do most Shopify stores have low conversion rates despite good traffic?
The most common pattern we see is a store that has invested significantly in traffic acquisition and very little in conversion optimization. The paid media is working, the SEO is building, but the store’s product pages do not answer purchase-blocking objections, the checkout has unexpected friction, mobile speed is degraded by unoptimized assets, and there is no personalization layer distinguishing new visitors from returning customers. None of these are dramatic failure individually. Collectively, they create the gap between a 1.4% conversion rate and what the traffic quality should be producing. The other common pattern is a store that ran a CRO audit two years ago and implemented accurate fixes then, but the Shopify platform has evolved, the customer has evolved, and the fixes are no longer aligned with current friction points.
Is Shopify Checkout Extensibility required for CRO improvements at checkout?
Since August 2024, checkout.liquid no longer functions for the core checkout pages (information, shipping, and payment). By August 2025, the thank you and order status pages also be migrated to Checkout Extensibility. This means any store still using the old checkout customization system is running on deprecated infrastructure that is not compatible with current Shop Pay optimization or modern upsell and trust element implementation. If your checkout was last reviewed before 2024, it is worth verifying that your current setup is running on Checkout Extensibility and taking advantage of the conversion improvements it enables, particularly Shop Pay integration and post-purchase upsell pages.
How long does it take to see results from a CRO audit implementation?
Mobile speed improvements typically show measurable impact within two to four weeks as Google’s field data catches up to the improved experience. Checkout friction fixes like adding Shop Pay or removing forced account creation show impact faster, often within a week, because they directly affect the conversion step where the decision is already made. Personalization and social proof improvements take longer to measure accurately because they require enough sessions to generate statistical significance. Budget 60 to 90 days from the first implementation to a reliable assessment of conversion rate movement. Teams that implement one fix at a time and measure before adding the next get cleaner attribution data and better long-term results than teams that batch all fixes simultaneously.
What is the difference between a generic CRO audit and an AI-assisted one?
A traditional CRO audit relies on a consultant reviewing analytics reports and session recordings, forming hypotheses based on what they observe, and recommending fixes based on pattern recognition from past experience. This is valuable but slow, sampling-dependent, and limited by the consultant’s frame of reference. An AI-assisted audit processes behavioral data at scale across your entire session history, identifies drop-off patterns that are statistically significant rather than visually interesting, and flags friction types that correlate with conversion loss across large datasets rather than in a sample of 20 session recordings. The practical difference is precision and speed. You get a prioritized list of specific friction points ranked by their statistical impact on your conversion rate, not a list of things that look like they might be problems.
Girish Panchal
Technical Architect
A Technical Architect, proficient in WordPress, Drupal, Laravel, and DevOps tasks, crafts robust IT solutions with a blend of expertise and versatility in web development and infrastructure management.




 KrishaLabs
 KrishaStudio
 KrishaStore