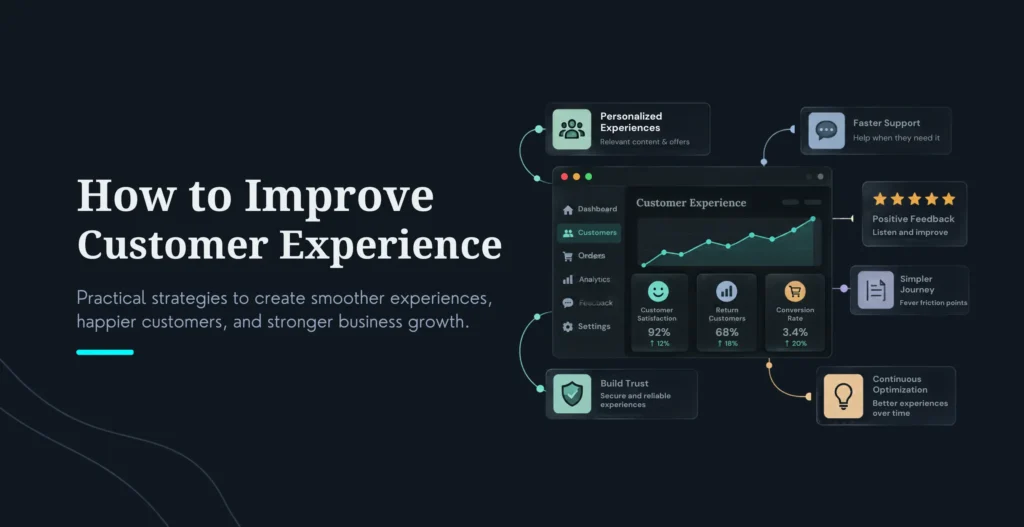
Most businesses know customer experience matters. Far fewer know how to improve customer experience in a way customers notice. According to Forrester’s 2026 Customer Experience Index, US CX quality improved for the first time since 2021, but remains slightly below 2024 levels. The gap is wide open for anyone who gets the basics right.
Here is the short answer. To improve customer experience, find where customers struggle, fix that friction first, and make every interaction faster, clearer, and more human. In 2026 that means a simple website, helpful self-service, AI support with an easy path to a person, and a small set of metrics you review every month. This guide covers 15 strategies, the numbers to track, and a four-step plan you can start this week.
Key Takeaways
Start with friction, not features. A faster checkout or clearer navigation usually beats a new tool.
AI works only with a human exit. Gartner’s 2026 survey found 87% of customers want a path to a person when a company uses generative AI.
Track three kinds of metrics. One for loyalty, one for effort, and one for outcomes.
Use the Friction-First method. Find, rank, fix, and prove, in that order, every month.
Table Of Contents
Table Of Contents
What Is Customer Experience (CX)?
Customer experience is the total of every interaction a person has with your business, from the first search to the last support chat. It includes your website, emails, pricing page, delivery, and how your team treats people when something goes wrong. Customer experience is every moment a customer spends with you, not just the moments you planned.
Forrester scores CX quality on three dimensions: effectiveness (did it work), ease (was it simple), and emotion (how did it feel). That is a handy test for any touchpoint you review. If a step fails on one of the three, it belongs on your fix list.
Term
What it covers
Example
Customer experience (CX)
Every interaction across the full relationship
Finding you on Google, buying, delivery, support, renewal
Customer service
Help given when a customer has a question or problem
A support chat about a late order
User experience (UX)
How easy and clear a website or product is to use
Whether checkout is simple on a phone
Why Is It Important to Improve Customer Experience in 2026?
The first good news in years came from Forrester’s 2026 Customer Experience Index. For the first time since 2021, US CX quality improved year over year with gains in effectiveness, ease and emotion. Scores still hover just below 2024. Looking at 2026, 20% of brands globally increased their CX Index Scores, while 8% of brands saw a decrease. The remaining brands were flat.
That flat middle is your opportunity. Forrester has noted that even a small gain in CX quality can reduce churn and raise share of wallet. Money also leaks quietly at checkout. Baymard Institute’s average across 50 studies is a 70.22% cart abandonment rate. You do not need to fix everything. Fixing the right three things can move revenue. Customers rarely announce a bad experience. They just stop buying.
What Are the Best Ways to Improve Customer Experience?
I would start with the strategies customers notice most in 2026: personalization, AI support, and listening. Then work down the list. Pick three, not fifteen. Teams that try everything at once finish nothing, and customers feel no difference.
1. Personalize with consent, not just a first name
Using a name in an email is table stakes now. Real personalization uses what a customer has told you or done: past orders, pages viewed, products saved, the plan they are on. McKinsey’s widely cited 2021 research found that 71% of consumers expect personalized interactions and 76% get frustrated when they do not receive them. It also found that companies that excel at personalization generate 40% more revenue from those activities than average players.
Start small. Ask two preference questions at signup, then use the answers in email and on-site recommendations. Say plainly what data you use and why. Personalization that feels helpful builds loyalty. Personalization that feels like surveillance ends it. Track repeat purchase rate and recommendation click-through.
2. Add AI support, and keep a human one click away
AI can answer order status, return rules, and password resets at any hour. Customers are warming to it. Gartner’s 2026 survey of 3,566 customers (B2B and B2C) found that 50% say interactions are easier when companies use generative AI. The same survey found that 87% say a company using it must offer a way to reach a human.
So design the handoff first. Let the bot resolve a question only when its confidence is high, and pass everything to a person when it is not, including the full transcript. Nobody should explain their problem twice. Gartner’s analyst advice is to avoid making AI a mandatory first step for every issue. Measure escalation rate and CSAT after AI-handled chats, not just how many chats the bot closed. If you are planning this, our AI solutions team can help you design the handoff.
3. Build a Voice of Customer program that closes the loop
A Voice of Customer program is a habit of listening in more than one place. Pull from post-purchase surveys, support tickets, product reviews, sales calls, and session recordings. Then do the part most teams skip: close the loop. Tell customers what you changed because of their feedback. A short “you said, we did” note in your newsletter or app takes an hour to write and shows people you listen.
Review the themes monthly with product, support, and marketing in the same room. Track the share of feedback items that lead to a shipped change. If that number is near zero, you are collecting opinions, not improving anything.
4. Map the customer journey and mark every friction point
A journey map shows each step a customer takes, from first search to renewal or repeat purchase, and how they feel at each one. Run a two-hour workshop with support, sales, and design. List the stages, the touchpoints, and the moments where people get stuck or annoyed. Include the steps before the sale and after it.
Mark each stuck point with how often it happens and what it costs you. Those marks become your fix list. Build the map from real tickets and analytics, not hunches. A map built on opinions just repeats your assumptions. Our website conversion audit checklist shows what we review before recommending changes.
5. Connect your channels so customers never repeat themselves
Customers do not think in channels. They start a chat on your site, follow up by email, then call. If each channel keeps its own notes, they repeat themselves three times. Connect your CRM, help desk, and messaging tools so every agent sees the full history. This is a systems and data job, which is where digital transformation work earns its keep. Measure repeat contacts per issue. When that number falls, your channels are finally talking to each other.
6. Build self-service that customers use
Plenty of customers would rather solve a simple problem alone at 11 p.m. than wait for a reply. Build a help center that earns that trust. Write articles from your top 20 support tickets, in the customer’s own words. Add search that handles typos and returns results fast. Put short guides inside the product or checkout, right where questions come up.
Review “no results” searches every month. Each one is a missing article. Track self-service resolution rate and the share of tickets that match an existing article.
7. Simplify website UX, navigation, and checkout
Your website is often the first and busiest touchpoint. Clear navigation, plain labels, and short forms do more for CX than most new tools. An earlier Baymard checkout benchmark of 60 leading ecommerce sites found the average site had 39 areas to improve, and Baymard estimates that better checkout design alone can lift conversion by about 35% for a large site.
Start with guest checkout, fewer form fields, and the total cost shown early. Then tighten navigation using our guide to website navigation best practices. Our breakdown of 7 UX design elements covers the building blocks. For a full journey audit, our UI/UX design services team can review it end to end.
8. Make mobile fast and accessible
Phones are where many customers meet you first, and where patience runs out fastest. Google’s Core Web Vitals give you clear targets, measured on real visits at the 75th percentile: Largest Contentful Paint within 2.5 seconds, Interaction to Next Paint within 200 milliseconds, and Cumulative Layout Shift of 0.1 or less. Check them in Search Console and PageSpeed Insights.
Accessibility belongs in the same conversation. Make sure people can use your site with a keyboard, that text has enough contrast, and that form fields have labels. These fixes help everyone, including a customer on a bright sidewalk with one thumb free. Our web development team builds to these targets from the start. Our guide to website accessibility and compliance goes deeper.
9. Reduce customer effort at every touchpoint
Effort is the quiet reason customers leave. Forrester scores ease alongside effectiveness and emotion, which tells you how seriously to take it. Count the steps in your top five tasks: placing an order, booking, getting a refund, changing a plan, reaching support. Cut every step that exists for your convenience rather than theirs.
Prefill details you already have. Remove forms that ask for the same data twice. Then measure Customer Effort Score right after each task, while the memory is fresh.
10. Resolve issues on first contact, and give front-line staff real authority
Few things frustrate customers like being passed from person to person. Give front-line staff authority to solve common problems on the spot: refunds up to a set amount, replacements, fee waivers. Pair that with training and a knowledge base they trust.
Ask your agents what slows them down, too. They hear the same complaints daily and often know the fix already. Measure first-contact resolution, and read it next to CSAT so speed never costs quality.
11. Use proactive support
The best support message is the one that arrives before the customer has to ask. Tell people when an order is delayed. Warn a subscriber that a card is about to expire. Flag a usage spike before the bill does. Proactive messages cut inbound tickets and show you are paying attention.
Keep them useful and rare, and let customers choose how they hear from you. Track ticket volume for the events you now announce yourself.
12. Build trust with transparency and privacy
Trust is built in small, visible choices. State shipping costs and return rules before checkout. Write your guarantee in plain words. Explain what data you collect and let customers change it. A clear money-back promise still reassures buyers, but only when it is easy to claim.
If a policy needs a lawyer to decode it, rewrite it. You can read trust indirectly through return reasons, complaint themes, and NPS comments.
13. Turn mistakes into service recovery moments
Every business makes mistakes. Customers remember what happens next. Acknowledge the problem quickly, fix it without making them argue, and add a small gesture when the error was yours. Then find the root cause so it does not repeat.
Treat each complaint as free research. Track time to resolution, and check whether customers who complained buy again within 90 days.
14. Improve onboarding and post-purchase support
The first 30 days set the tone for the whole relationship. For software, that means a short setup path to the first win. For ecommerce, it means clear order tracking, easy returns, and a useful follow-up instead of an instant upsell.
Send one helpful message after delivery or first use, and ask a single question about how it went. Track time to first value, repeat purchase rate, and early churn.
15. Test and optimize every month
Treat CX as a monthly routine, not a one-off project. Pick one friction point, form a hypothesis, test a fix, and read the result. Small tests add up: a clearer button label, a shorter form, a different help-center layout. Review your CX metrics monthly and your journey map each quarter.
How Do You Measure Customer Experience Improvement?
Track effort before you track delight. A customer who finds things easy tends to stay, and effort is the metric you can move fastest. Pick one metric for loyalty, one for effort, and one for outcomes. Add CSAT after key moments. Here is how each one is calculated, with a worked example you can reproduce.
Metric
Formula
Worked example
Best used for
CSAT
(Satisfied responses ÷ total responses) × 100. “Satisfied” means 4 or 5 on a 5-point scale.
80 of 100 customers rate 4 or 5, so CSAT is 80%
After a purchase or support chat
NPS
% promoters (scores 9 to 10) minus % detractors (0 to 6) on a 0 to 10 scale
50 promoters, 30 passives, 20 detractors out of 100: 50% minus 20% gives an NPS of 30
Long-term loyalty
CES
Average agreement with “It was easy to get this done” on a 1 to 7 scale
Scores of 6, 7, 5, and 6 average 6.0
Checkout, onboarding, support
Retention rate
((Customers at end − new customers) ÷ customers at start) × 100
(1,050 − 200) ÷ 1,000 = 85%
Subscriptions and repeat purchase
First-contact resolution
(Issues solved on first contact ÷ total issues) × 100
720 of 1,000 tickets, so FCR is 72%
Support efficiency
Conversion rate
(Completed target actions ÷ sessions) × 100
300 orders from 10,000 sessions is 3%
Site and checkout performance
Capture a baseline before you change anything, then compare like for like over the same length of time. Account for seasonality. A holiday spike is not proof your new help center works. For finding UX problems in your data, see our guide to boosting website UX with analytics.
What Do Good Customer Experience Examples Look Like by Industry?
These are illustrative scenarios, not client results. They show how the same strategies change shape by industry.
Ecommerce. Picture a store where most mobile shoppers drop off at the account-creation step. Guest checkout and a wallet payment option attack the biggest friction point first. Measure checkout completion rate before and after. For more on this, see our guide to ecommerce customer experience and our ecommerce development work.
SaaS and B2B services. A software company finds that many trial users stall before connecting their data. A guided setup, a short checklist, and a human check-in on day three can fix the stall. Track time to first value and trial-to-paid rate. Self-service and AI support also help here without raising support costs.
Banking and healthcare. Trust and clarity decide everything. Plain-language forms, secure messaging, appointment reminders, and a clear route from chatbot to staff matter most. Be explicit about how you use personal data. See our work for banking and finance and healthcareteams.
How Do You Build a Customer Experience Improvement Plan?
I call this the Friction-First method. It has four steps and fits on one page. Fix the friction that costs you the most customers, not the friction that annoys you the most.
Step
What you do
What you end up with
Find
Review analytics, tickets, and survey data, then run a journey workshop. List every place customers stall, complain, or leave.
A friction list of 15 to 30 items
Rank
Score each item by how many customers it affects, what it costs, and how hard it is to fix.
Your top three fixes
Fix
Ship the top three in 30 to 60 days. Keep changes small so you can tell what worked.
Released improvements
Prove
Compare effort, satisfaction, and conversion metrics before and after. Share the results, then repeat.
A monthly CX scorecard
A realistic first quarter looks like this. Weeks 1 and 2: audit and workshop. Weeks 3 and 4: rank and agree the top three. Weeks 5 to 10: build and release. Weeks 11 and 12: measure, share, and pick the next three. Then keep going.
What Customer Experience Mistakes Should You Avoid?
AI-first forcing. People like AI when it helps them and dislike it when it gets in their way. Gartner’s 2026 survey is a clear warning: 87% want access to a human. Let people skip the bot.
Collecting feedback and doing nothing. Surveys with no visible follow-up teach customers to stop answering. Close the loop on every theme.
Personalizing without permission. It feels intrusive when you use data customers did not opt in to give. Be clear about what you collect, and give people control.
Fixing one channel while others stay broken. A polished website means little if support is slow and billing is confusing. Forrester’s 2026 Total Experience research says the same: when the brand promise, customer experience, and the teams that deliver it become misaligned, growth stalls.
Chasing the score instead of the cause. A higher NPS is not the goal. Fewer stuck customers is. Read the comments, find the cause, and fix that.
Frequently Asked Questions
What are the most effective ways to improve customer experience?
Start with the basics that remove friction: a simple website and checkout, fast mobile pages, clear policies, and quick first-contact resolution. Then add listening through surveys and support data, connected channels so customers never repeat themselves, and AI support with an easy path to a person. Pick the three biggest friction points from your journey map and fix those first. Measure effort, satisfaction, and conversion before and after, so you know what worked.
How can small businesses improve customer experience on a budget?
You do not need big software spend. Reply to messages faster, write a short help page from your most common questions, simplify your checkout or booking form, and ask every customer one question after purchase. Read your reviews weekly and fix repeat complaints. Free tools such as Google Search Console, PageSpeed Insights, and a basic survey form cover most measurement needs. Consistency matters more than budget here.
How does AI improve customer experience?
AI improves customer experience when it answers routine questions instantly, routes complex ones to the right person, and gives agents summaries and suggested replies. It backfires when it blocks access to a human. Gartner’s 2026 survey found that 87% of customers say a company using generative AI must offer a way to reach a human. Use AI for speed, and keep a clear handoff for anything sensitive or unresolved.
What is the difference between customer experience and customer service?
Customer service is the help you give when a customer has a question or a problem. Customer experience is bigger. It covers every interaction, including finding your brand, using your website, buying, getting support, and renewing. Good service is one part of good CX. A customer can still have a poor experience after friendly service if your checkout is confusing or your delivery is late.
How do you measure customer experience improvement?
Pick one metric for loyalty (NPS or retention), one for effort (Customer Effort Score), and one for outcomes (conversion rate or first-contact resolution). Capture a baseline, change one thing at a time, and compare results over comparable periods. Add CSAT after key moments such as purchase and support. Read the open-text comments too. They explain why the numbers moved.
How long does it take to see results from CX improvements?
Simple fixes, such as shorter forms or clearer policies, can show up in conversion and effort scores within weeks. Loyalty and retention shift more slowly, often over a few months, because they depend on repeat behavior. Compare like for like, account for seasonality, and avoid crediting every change to one fix. Review results monthly and expect steady gains rather than a single jump.
Final Thoughts
Improving customer experience is rarely about one big move. It is a steady habit of finding friction, fixing it, and checking that customers noticed. Start with your top three friction points, pick three metrics, and review them monthly.
If you want a second set of eyes, our UI/UX design services team can audit your website journeys, and our digital transformation team can connect the systems behind them. If AI support is on your roadmap, our AI solutions team can help you build it with a clear human handoff. Talk to our team and we will start with your biggest friction point.
Praful Patel
Lead – CMS Development
A Full-Stack Developer and Technical Project Manager with expertise spanning WordPress, WooCommerce, Headless WordPress, Next.js, React, and AI Automation, I deliver end-to-end web solutions that combine technical depth with practical, business-focused thinking.




 KrishaStudio
 KrishaStore