Most SaaS homepages fail for the same reason: they are written for the company, not for the visitor. They lead with product names, feature lists, and awards the visitor has never heard of. They bury the value proposition three scrolls down. They ask for a demo before giving anyone a reason to want one. The average B2B SaaS homepage converts between 1.5% and 2.5% of visitors. The top 10% convert at 8% to 15%. That gap is not a traffic quality problem or a design budget problem. It is a clarity, proof, and friction problem, and every part of it is fixable. This guide covers what the highest-converting SaaS homepages in 2026 are actually doing, with the evidence behind each decision.
Table Of Contents
Table Of Contents
The Benchmark Reality Before You Optimize Anything
Before you rearrange sections or rewrite the hero, it helps to know where you are. The average SaaS homepage visitor-to-lead conversion rate sits at 1.5% to 2.5%. Top performers in B2B SaaS reach 8% to 15%. The median for SaaS landing pages overall is around 3.8%, according to Unbounce benchmark data. Single-goal pages with one focused CTA reach 13.5% conversion, compared to 10.5% for pages with multiple competing CTAs (Source:SaaSHero).
If you are sitting at 0.8% or 1%, you are not suffering from marginal inefficiency. Something fundamental is not working. The good news is that the gap between 1% and 3% is usually explained by a handful of specific, correctable problems, and the sections below cover what they are.
One other number worth holding: the difference between pages written at a plain reading level and those written in “professional” B2B language is a conversion rate of 12.9% versus 2.1% in documented SaaS homepage studies. That is not a small rounding difference. Clarity is not dumbing down your product. It is the fastest conversion optimization available.
The Hero Section: You Have About Five Seconds
Every head of marketing knows the hero section matters. Fewer of them know exactly why most heroes fail, which makes the fix harder to land. Here is the most common version: the headline describes what the company does from the company’s perspective. The subhead adds context the visitor does not yet need. The CTA says “Get Started” or “Learn More” without specifying what comes next. The visual is a product screenshot that is too small to read or a stock photo of people collaborating in an open-plan office.
A visitor who lands on that page and has not heard of your product makes a decision in under five seconds about whether to stay. If the headline does not answer “what does this do for me, specifically?”, the majority leave. Not because they are wrong for your product. Because you lost them before you had a chance to show them.
The fix is not complicated, but it requires overcoming internal resistance. Stakeholders who have worked on the product for two years often want the headline to reflect the sophistication of what was built. Visitors who have never heard of your product need to understand in one sentence what problem it solves. Those two things are rarely the same sentence.
Benefit-focused headlines against product-focused controls produce lifts of 27% to 31% in documented tests. One agency replaced a 14-word, jargon-heavy hero headline with a 6-word statement that said exactly what the product did and saw a 27% increase in demo clicks in 9 days. Same product. Same design. Same traffic. Just different words (Source:Stan Vision).
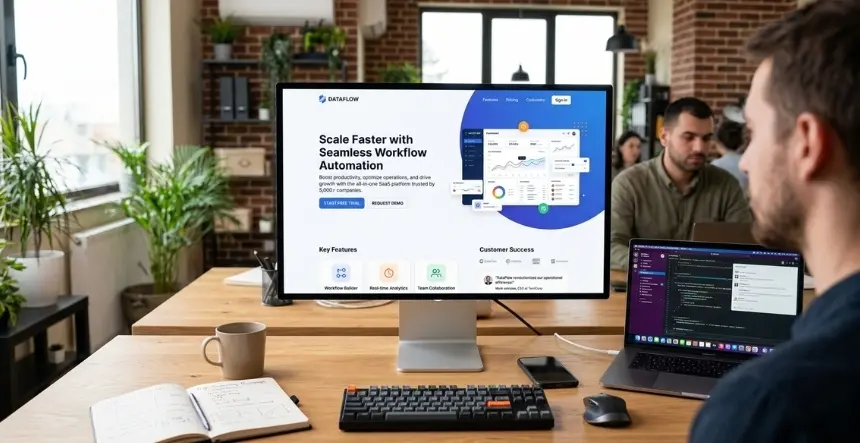
A strong hero needs four things working together. The headline states the outcome your buyer wants, not what your product is. The subhead explains briefly how you deliver it and who it is for. The visual shows the product in action, not an idea of the product. And the CTA is specific enough that clicking it does not feel like a leap of faith. “Start My Free Trial” beats “Get Started.” “See It In 2 Minutes” beats “Learn More.” First-person phrasing beats second-person. Specificity beats warmth every time.
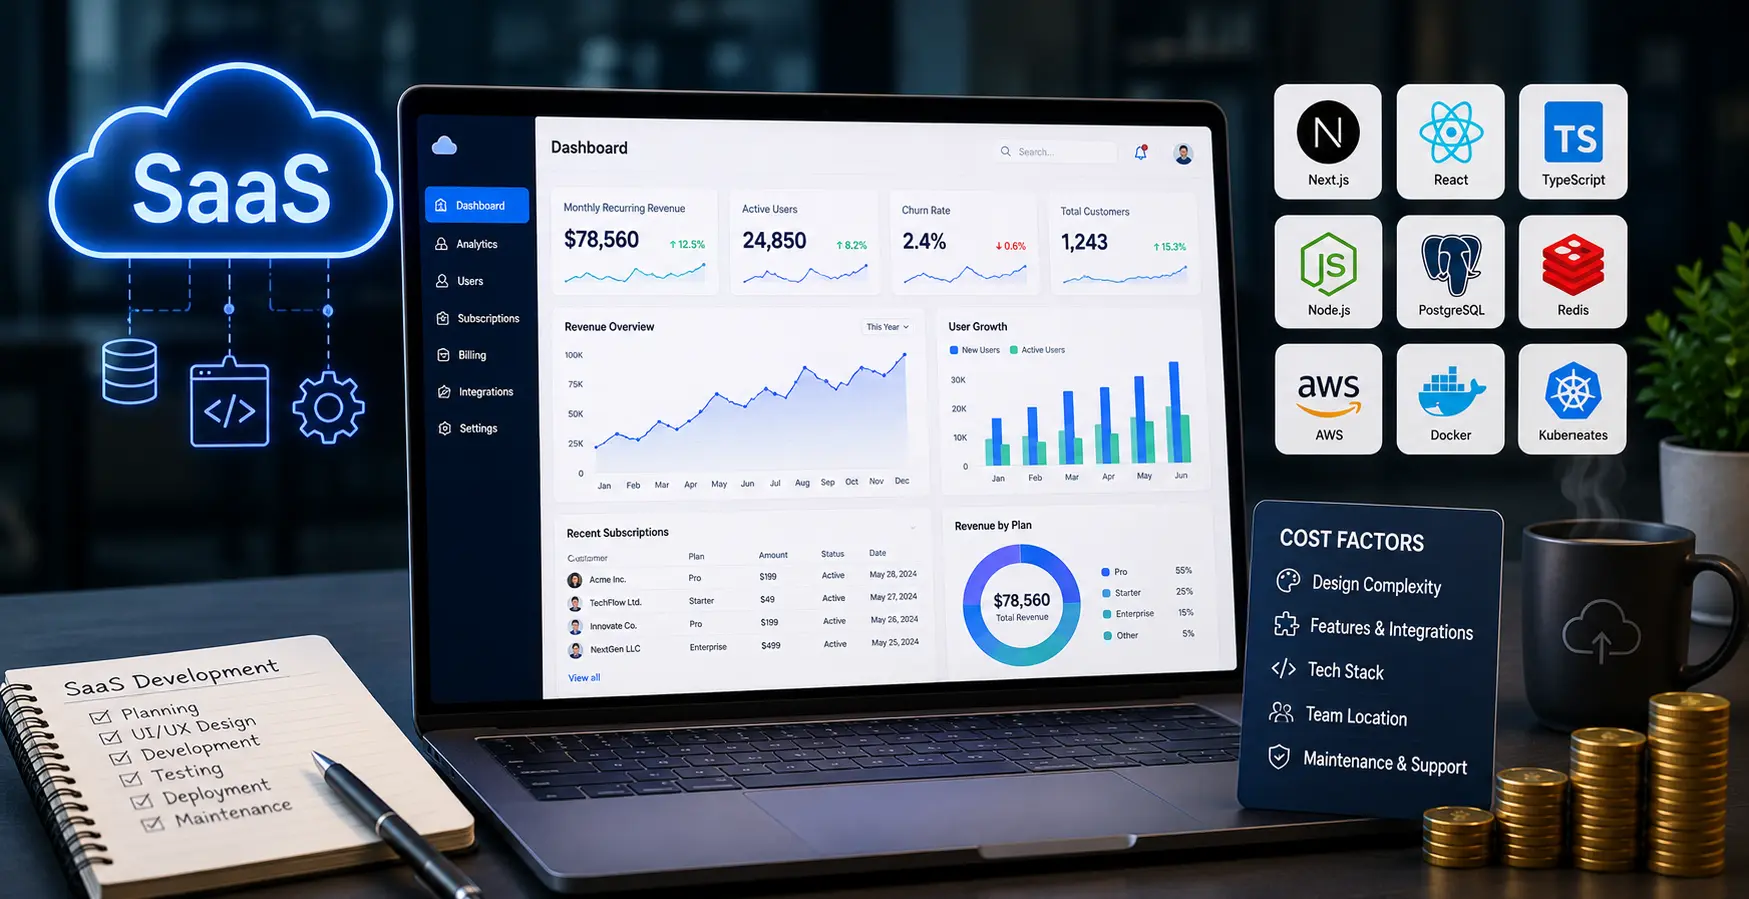
On the visual: in 2026, static illustrations are largely gone from high-performing SaaS homepages. What replaced them is actual product UI – screenshots, short looping screen recordings, or interactive micro-demos. Visitors want to see what they are buying before they decide to find out more. An abstract illustration of interconnected nodes tells them nothing. A screenshot of your dashboard, even small, tells them what kind of tool this is and starts the mental model they need to convert.
Social Proof: Earlier Than You Think, More Specific Than You Have
Only 46% of SaaS websites include social proof in the hero section. That means more than half of SaaS homepages wait until visitors have scrolled past the fold before giving them any reason to trust what the headline just claimed (Source:Tenet). The visitors most likely to bounce are the ones who have not yet decided whether to stay, exactly the people who need to see proof before anything else.
Social proof works when it is specific, near the decision, and visible without scrolling. A logo strip of recognizable companies placed directly below the hero CTA is the highest-density trust signal available. A single sentence from a named client with a specific result, not a generic compliment, placed within one scroll of the form does more work than a full testimonials section buried at the bottom.
The specificity issue is worth pressing on. “Game-changer for our team” is the kind of testimonial that appears on 80% of SaaS homepages and creates zero differentiation. “We reduced our sales cycle from 45 days to 22 using the pipeline scoring module, and that was in the first 30 days” is the kind of testimonial that a visitor with the same problem will read twice.
Adding social proof to key conversion areas improves conversion rates by 15% to 25% in aggregate. Video testimonials near CTAs produce an 80% lift. The research on optimal homepage testimonial count puts three to five as the right number for the homepage itself, enough to signal credibility, not so many that the page becomes a slide deck of praise (Source: Genesys Growth).
The section sequencing that high-performing SaaS homepages follow in 2026: hero, social proof, features framed as outcomes, product demo, testimonials with specific results, pricing or pricing teaser, FAQs, closing CTA. That sequence mirrors how a buyer actually evaluates a product – understand it, trust it, see it, validate it, check the price, make the decision. Breaking that sequence by putting the pricing section above the demo, or the testimonials before the feature explanations, creates friction in the buyer’s evaluation process that most teams never notice in their analytics.
The Product Demo Question
Two years ago the standard advice was: put a product screenshot in the hero. Today the standard for high-performing SaaS homepages has moved to interactive demos, embedded product tours that let visitors click through core workflows without signing up or talking to anyone.
The case for this is direct. Nobody books a call just to understand what your product does anymore. If they have to schedule a 30-minute demo with a sales rep to see whether your product fits their workflow, most of them will not. They will go to a competitor that shows them the product on the homepage and lets them try it in 90 seconds.
Interactive demos built with tools like Navattic, Arcade, or Guideflow can be embedded on a Webflow or WordPress homepage without custom development. They convert at meaningfully higher rates than static screenshots because they let the visitor achieve the most important thing in the conversion decision: understanding what the product actually does in the context of their problem. Companies like Amplitude, Zendesk, and Forest Admin use this approach at scale. Replacing static screenshots with a 90-second interactive walkthrough has driven demo request rates to roughly double in several documented implementations (Source:Aimers).
The interactive demo does not replace a live demo with a sales rep for complex enterprise sales. It answers the “is this worth my time?” question that every visitor is asking before they decide whether to book a call. That is the gap it closes.
Not every SaaS product is visual enough for this to be obvious. If your product is primarily data pipelines or backend infrastructure, a workflow-style interactive demo may not translate. In that case, a 15-second looping screen recording showing the output – the dashboard, the report, the alert, still outperforms an illustration of the concept.
Pricing Transparency: The Self-Serve Expectation
Hiding pricing behind a “Contact Sales” form was a defensible strategy in 2015. By 2026, it costs conversion in almost every SaaS category outside of large-enterprise pure-play software.
Transparent pricing pages convert 15% to 25% better than “Contact Sales” approaches for self-service and mid-market SaaS products (Source:Artisan Growth Strategies). The buyers doing their initial research, the people comparing three to five alternatives before they talk to anyone, want to know whether your product is in their budget before they invest time in understanding it. If your pricing is not visible, many of them remove you from the list rather than booking a call to ask.
This does not mean every SaaS company should publish exact prices. The tiered approach, showing three pricing tiers with the middle one highlighted as the recommended option, gives self-serve and SMB buyers the information they need to qualify themselves, while leaving enterprise deals open-ended with a “Contact Sales” path at the high end. Three tiers work specifically because of the center-stage effect: people presented with three options disproportionately choose the middle one, which is also typically your best-margin tier. SaaS companies with three pricing tiers convert at 1.4 times the rate of those with two tiers (Source: PipelineRoad).
For the homepage itself, a pricing teaser, not a full pricing page, just a starting price or a tier overview, is enough to prevent the drop-off that happens when buyers cannot estimate cost. “Starting at $49/month” with a link to the full pricing page keeps them in the funnel. “Pricing available on request” sends a signal that the product is either expensive or the company is not confident in its price.
The CTA Architecture: One Primary Action, One Escape Hatch
The most damaging mistake on a SaaS homepage is a page that genuinely cannot decide what it wants visitors to do. Five CTAs in the hero section. A “Start Free Trial” button next to a “Book Demo” button next to a “Watch Video” link next to a “Learn More” dropdown. These pages convert poorly not because they give visitors too many options, but because they signal to visitors that the company has not thought clearly about what value it is offering or who it is offering it to.
One primary CTA. One. The rest of the page supports that one action, repeating it at each natural scroll point where the visitor’s decision could go either way. If you offer both a free trial and a demo path, make one primary and the other clearly secondary. For product-led growth companies where self-serve trial is the motion, the free trial is primary. For sales-led companies with complex products and longer cycles, the demo request is primary.
The secondary CTA, “Watch how it works” or “See a 2-minute demo”, serves as an escape hatch for visitors who are not yet ready to commit to the primary action. It keeps them on the page and moves them toward understanding the product rather than sending them back to Google. This is not optional for SaaS with longer consideration cycles. Not every visitor is ready to start a trial the first time they arrive. The secondary CTA captures their interest at an earlier stage.
CTA button copy matters more than most marketing teams treat it. “Submit” and “Get Started” are friction-generating words because they describe an action the visitor takes without telling them what they receive. “Start My Free Trial,” “Get My Free Audit,” and “Book a 20-Minute Demo” describe the outcome. First-person phrasing (“My” vs. “Your”) consistently outperforms in tests because it puts the visitor in the action rather than observing it. Specific CTA copy matched to audience and intent outperforms generic copy by up to 202% in documented personalization tests (Source:Genesys Growth).
AI Personalization: The Gap Between Average and Top Performers
The widest operational gap between SaaS homepages converting at 2% and those converting at 8% or higher in 2026 is not in any single element; it is in whether the page is static or dynamic.
Static pages show every visitor the same hero headline, the same CTA, the same social proof, and the same product emphasis regardless of where they came from, what role they hold, or what problem they are trying to solve. A CFO evaluating your product and a growth engineer evaluating the same product have different primary concerns. A visitor arriving from a LinkedIn ad targeting HR directors and a visitor landing from organic search for “project management software for agencies” are at different intent levels and have different reference points.
AI-powered personalization tools – Webflow Optimize, Mutiny, RightMessage, allow the homepage to show different headlines, different social proof logos, and different CTAs based on traffic source, visitor firmographics, device, or CRM data for known contacts. Personalized CTAs convert 202% better than default versions. Source-level personalization, showing visitors from different campaigns different hero messages, is the simplest implementation and consistently produces 20% to 40% conversion lifts for teams that set it up.
The barrier to entry has dropped. You do not need an engineering sprint to implement source-level dynamic headlines on a Webflow homepage. Webflow Optimize handles traffic routing and variant serving natively. Mutiny can dynamically rewrite segments of the page based on IP-level firmographic data from Clearbit. For teams not ready for either, even UTM-triggered landing page variants, separate pages for separate campaigns, achieve the same intent-matching effect with less infrastructure.
The principle is simple even if the implementation has degrees of complexity: a visitor who sees messaging relevant to their specific situation converts at higher rates than one who sees generic messaging. That is not a CRO insight unique to 2026. What changed is that the tools to do it without a dedicated engineering team are now accessible.
Page Speed and Mobile: The Table Stakes Nobody Skips
Every second of additional load time costs approximately 7% in conversions. For a homepage converting at 3%, the difference between a 2-second load and a 5-second load is 0.6 percentage points, roughly a 20% reduction in overall lead volume from the same traffic. This is not a theoretical calculation. It shows up directly in GA4 data, segmented by page load time, consistently, on every SaaS homepage with enough traffic to read.
Mobile traffic represents the majority of SaaS homepage visits, even in B2B categories where you might expect desktop to dominate. Unbounce benchmark data shows 83% of landing page traffic coming from mobile. Desktop still converts roughly 8% better than mobile, but if your mobile experience is not optimized for it, that gap becomes a conversion floor rather than a target to improve toward.
For SaaS specifically, mobile optimization is not about making the desktop layout smaller. It is about ensuring the headline is readable at 375px without scrolling, the CTA button is large enough to tap with a thumb, the form fields are manageable on a phone keyboard, and the page loads in under 3 seconds on a mid-range mobile connection. If you have not loaded your own homepage on a 4G connection recently, do it now. That is what a significant portion of your visitors experience.
What High-Performing SaaS Homepages Deliberately Leave Out
This section tends to surprise people. The impulse when building a SaaS homepage is to include more: more use cases, more integrations, more testimonials, more features. More information means more reasons to convert, right?
No. More information creates cognitive load, which creates doubt, which creates delay, which creates lost conversions. The most counterintuitive principle behind the highest-converting SaaS homepages in 2026 is deliberate omission. They leave out the company history. They do not list every feature. They do not show every industry they serve. They do not explain every integration. They focus on one ICP with one primary problem and one path to conversion, and they do everything in service of that.
What gets cut: rotating hero carousels (they reduce clarity, always), generic value statements that could describe any software company, features that are table stakes for the category and add nothing to differentiation, excessive navigation options that create off-ramps before a visitor has decided to convert, and social proof elements that do not connect to the specific claims made on the page.
What stays: the one problem your best customers had before they found you, evidence that you solve it reliably with specific results, a path to experiencing that for themselves, and a reason to act now rather than later.
The average B2B SaaS homepage converts at 1.5% to 2.5%. Top performers convert at 8% to 15%. That gap is explained by clarity, proof, and friction, not design budget or traffic quality.
The hero section decides whether a visitor stays or leaves in under five seconds. Outcome-focused headlines outperform product descriptions. Product UI outperforms illustrations. Specific first-person CTA copy outperforms generic labels.
Social proof belongs near the decision, not at the bottom of the page. Logo strips below the hero CTA, results-specific testimonials near forms, and three to five homepage testimonials curated for relevance are the pattern that works.
Interactive demos embedded on the homepage, not gated, not requiring a sales call, directly address the “is this worth my time?” question that every visitor is resolving before they convert.
Pricing transparency converts 15% to 25% better than “Contact Sales” for self-serve and mid-market SaaS. Three tiers, with the middle one positioned as the recommended option, capture the broadest range of buyers.
One primary CTA, repeated. A secondary escape hatch for visitors not yet ready. No competing actions in the hero section.
AI personalization is what separates static 2% homepages from dynamic 8% ones. Source-level dynamic headlines and segment-specific CTAs are accessible without an engineering team in 2026 on Webflow.
Page speed is not optional. Every additional second of load time costs 7% in conversions.
Frequently Asked Questions
What should be above the fold on a SaaS homepage?
At minimum: an outcome-focused headline, a subhead explaining how and for whom, a primary CTA with specific benefit-forward copy, and one piece of social proof, either a logo strip or a single strong testimonial. Product UI or a short interactive demo rounds this out. Everything above the fold should answer three questions in under five seconds: what does this do, who is it for, and what do I do next.
How long should a SaaS homepage be?
Long enough to address the objections and questions a first-time visitor has before they convert, and no longer. For self-serve PLG products, shorter is usually better. For complex B2B products with longer consideration cycles and multiple stakeholders, a longer page that addresses different buyer concerns in sequence, outcomes, proof, product depth, pricing, and FAQ outperforms a shorter one that leaves questions unanswered. There is no universal right answer. The right length is defined by what your visitor needs to decide.
Should a SaaS homepage show pricing?
For self-serve and mid-market SaaS, yes. Transparent pricing converts 15% to 25% better than “Contact Sales” for those segments. The most common approach is a pricing teaser on the homepage with a link to the full pricing page. Full pricing pages with three tiers (starter, recommended, enterprise) perform best. Enterprise-only SaaS with complex, custom pricing structures are the exception where “Contact Sales” is still appropriate.
How do I improve SaaS homepage conversion rate without a redesign?
Start with the elements that affect every visitor: rewrite the hero headline to be outcome-focused and specific to your ICP, rewrite the primary CTA to be benefit-forward and first-person, move your best testimonial to within one scroll of the primary CTA, and check your page load speed on mobile. Those four changes require no redesign and can typically be implemented in a week. Measure the impact before touching anything structural.
What is a good SaaS homepage conversion rate?
The average B2B SaaS homepage converts at 1.5% to 2.5%. A rate above 3% is meaningfully above average. Top performers in well-defined ICP segments with strong messaging and social proof reach 8% to 15%. What matters more than hitting a benchmark number is the direction of your trend over successive optimization cycles.
Conclusion
The gap between a SaaS homepage that generates consistent pipeline and one that gets traffic and produces almost nothing is not a mystery. It is clarity, social proof placed where visitors actually need it, product visibility before the ask, and a single clean path to conversion. Most of the changes are not architectural. They are messaging and sequencing decisions that can be made and tested inside a single sprint.
KrishaWeb’s web design and development services approach SaaS homepage builds and redesigns the same way: positioning-first, then structure, then copy, then visual execution. Our CRO services team audits existing homepages against the benchmarks covered here and builds a prioritized test roadmap. Where AI personalization and dynamic content are the right next step, our AI consulting practice implements the tooling connected to your CRM and traffic sources.
The Free AI Website and CRO Audit delivers a structured review of your current homepage against conversion benchmarks, a gap analysis of the highest-impact elements, and a prioritized action plan, within 5 business days.
Disclosure: Conversion rate benchmarks and statistics cited are drawn from third-party research published in 2025 and 2026. Results vary based on product category, ICP definition, traffic quality, and implementation quality. All figures are for planning and benchmarking purposes and are not a guarantee of specific outcomes.
Nisarg Pandya
Project Manager
Experienced Project Manager and Scrum Master at KrishaWeb, delivers expertise in Scrum methodologies, Laravel, React.js, UX design, and project management, ensuring efficient project delivery and agile implementation.